( Breadfast · Ops product & driver engagement · Egypt )
Designing
trust
Breadfast runs quick commerce grocery delivery across Egypt on the backs of thousands of Delivery Associates. None of them could see how they were being paid, so they reconciled it by hand, in a phone notes app, order by order.

drop in DA attrition, the problem the project existed to solve
adoption across active Delivery Associates
less engineering involvement in incentive configuration
to implement an incentive change, end to end
( 01 · Overview )
Trust was eroding on both sides
Delivery Associates are the backbone of Breadfast's operations. As quick commerce competition intensified across Egypt, retaining experienced DAs became a strategic priority. Training a new driver is slow and expensive, and competitors were actively recruiting ours.
DAs had no visibility into how they were paid. Every cycle they tracked and calculated each incentive by hand, order by order, in their phone's notes app, trying to estimate what they'd earn.
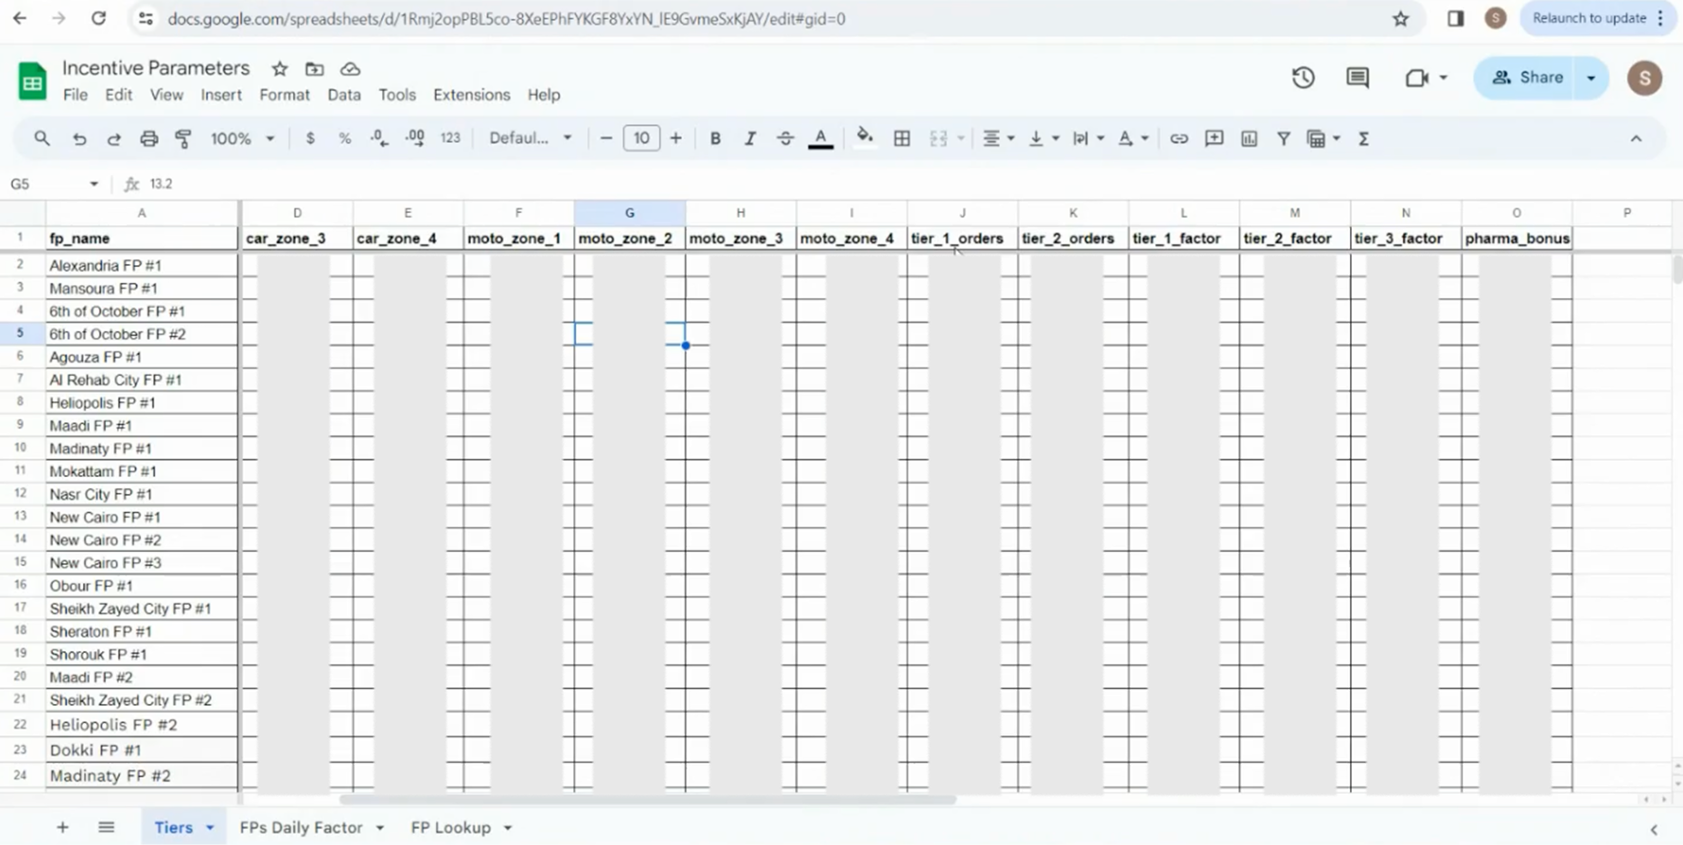
On the other side of the same system, the operations team ran incentive configuration out of this spreadsheet, entering every value manually, cell by cell. Any change, however minor, required an engineer to go into the backend and edit code by hand.
Trust was eroding on both sides. This project was about fixing that.
( 02 · Research & discovery )
They couldn't read the explanation. They could read the numbers.
I led the research end to end: formal 1:1 interviews with 12 Delivery Associates and 5 operations coordinators.
For the DAs I deliberately chose 1:1 interviews over focus groups. This persona tends to exhibit social bias in group settings, masking their real frustrations. One on one, the picture was much clearer.
I also segmented the cohort carefully, by tenure at Breadfast and by whether they had worked for a competitor before. That gave me a richer picture of what they expected, and showed where Breadfast was falling short of it.
What I found was striking. DAs were not passive about their earnings. They set daily and end of cycle monetary targets for themselves, and tracked every incentive payout by hand, order by order. Many could not read or write, yet they read numbers fluently and knew their own pay in detail. They were catching payment errors that Breadfast had no fast way to verify. A DA would take a discrepancy to a coordinator, and the coordinator would have to go digging through a spreadsheet to answer it. Often the DA was right.
"I used to sit after every shift and add it all up on my notes app. Half the time the numbers didn't match what I got paid."DA 1
( 03 · The design challenge )
One system, three users who wanted opposite things
The core challenge was unifying an incredibly complex incentive structure into a single coherent system that worked for three very different users.
Everything downstream depends on one shared layer: a taxonomy of named, configurable incentive types. Two products read from it, and all three users meet it somewhere.
Delivery Associates
Full pay transparency, designed for zero technical literacy and for people who cannot read or write.
Operations coordinators
Complete control over incentive configuration, without depending on engineering for every change.
Engineering
Freed from routine configuration work entirely, so their time went to product rather than spreadsheet translation.
( 04 · The hardest problem )
The incentives had no names
The hardest part of this project wasn't an interface. It was that the custom incentives had no structure at all.
Operations would decide they wanted more DAs working on a particular day, or during a particular window, and simply issue extra money. There was no name for these, no category, no shared definition. Just a date, a time and an amount, arranged case by case and typed into a spreadsheet. Nothing in that arrangement could be shown in a product, because there was nothing consistent to show.
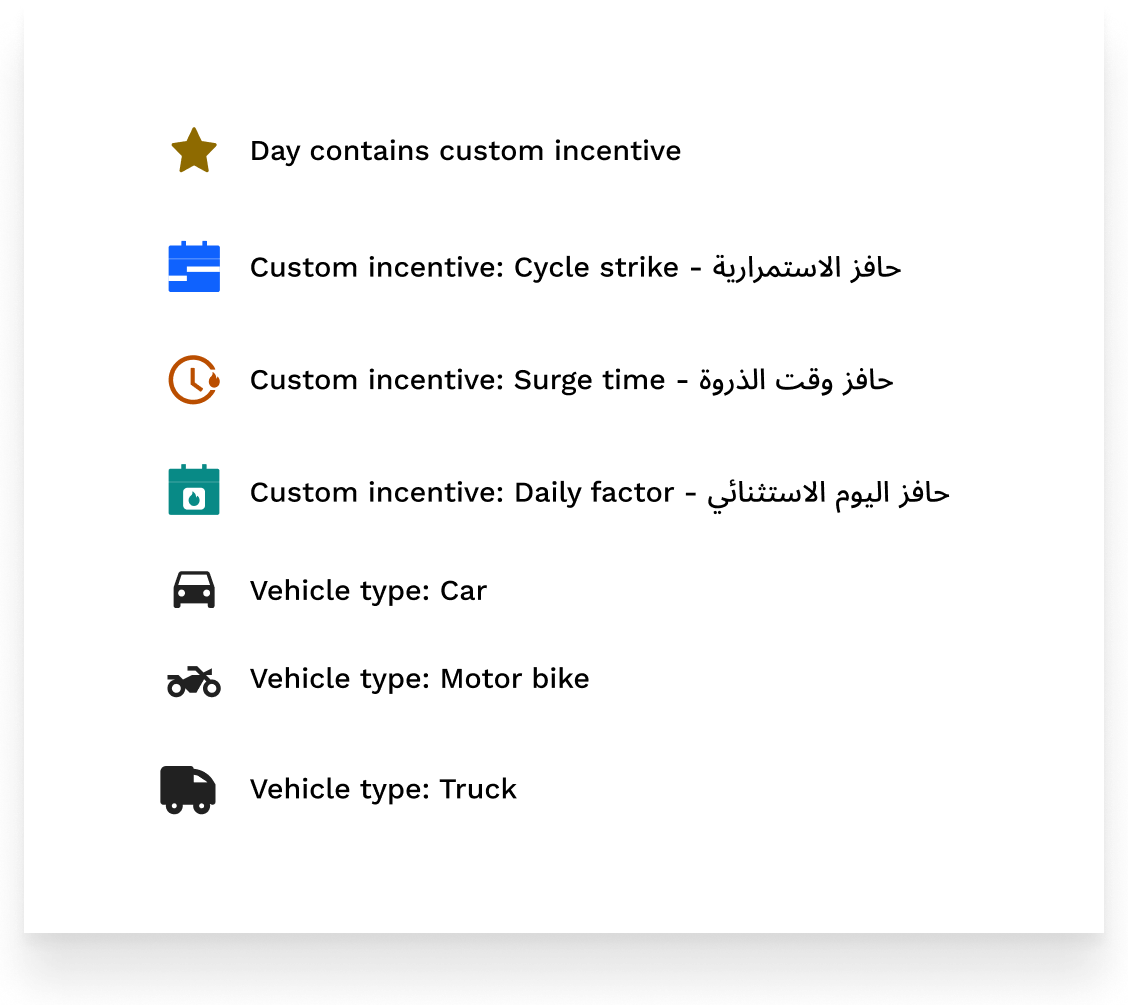
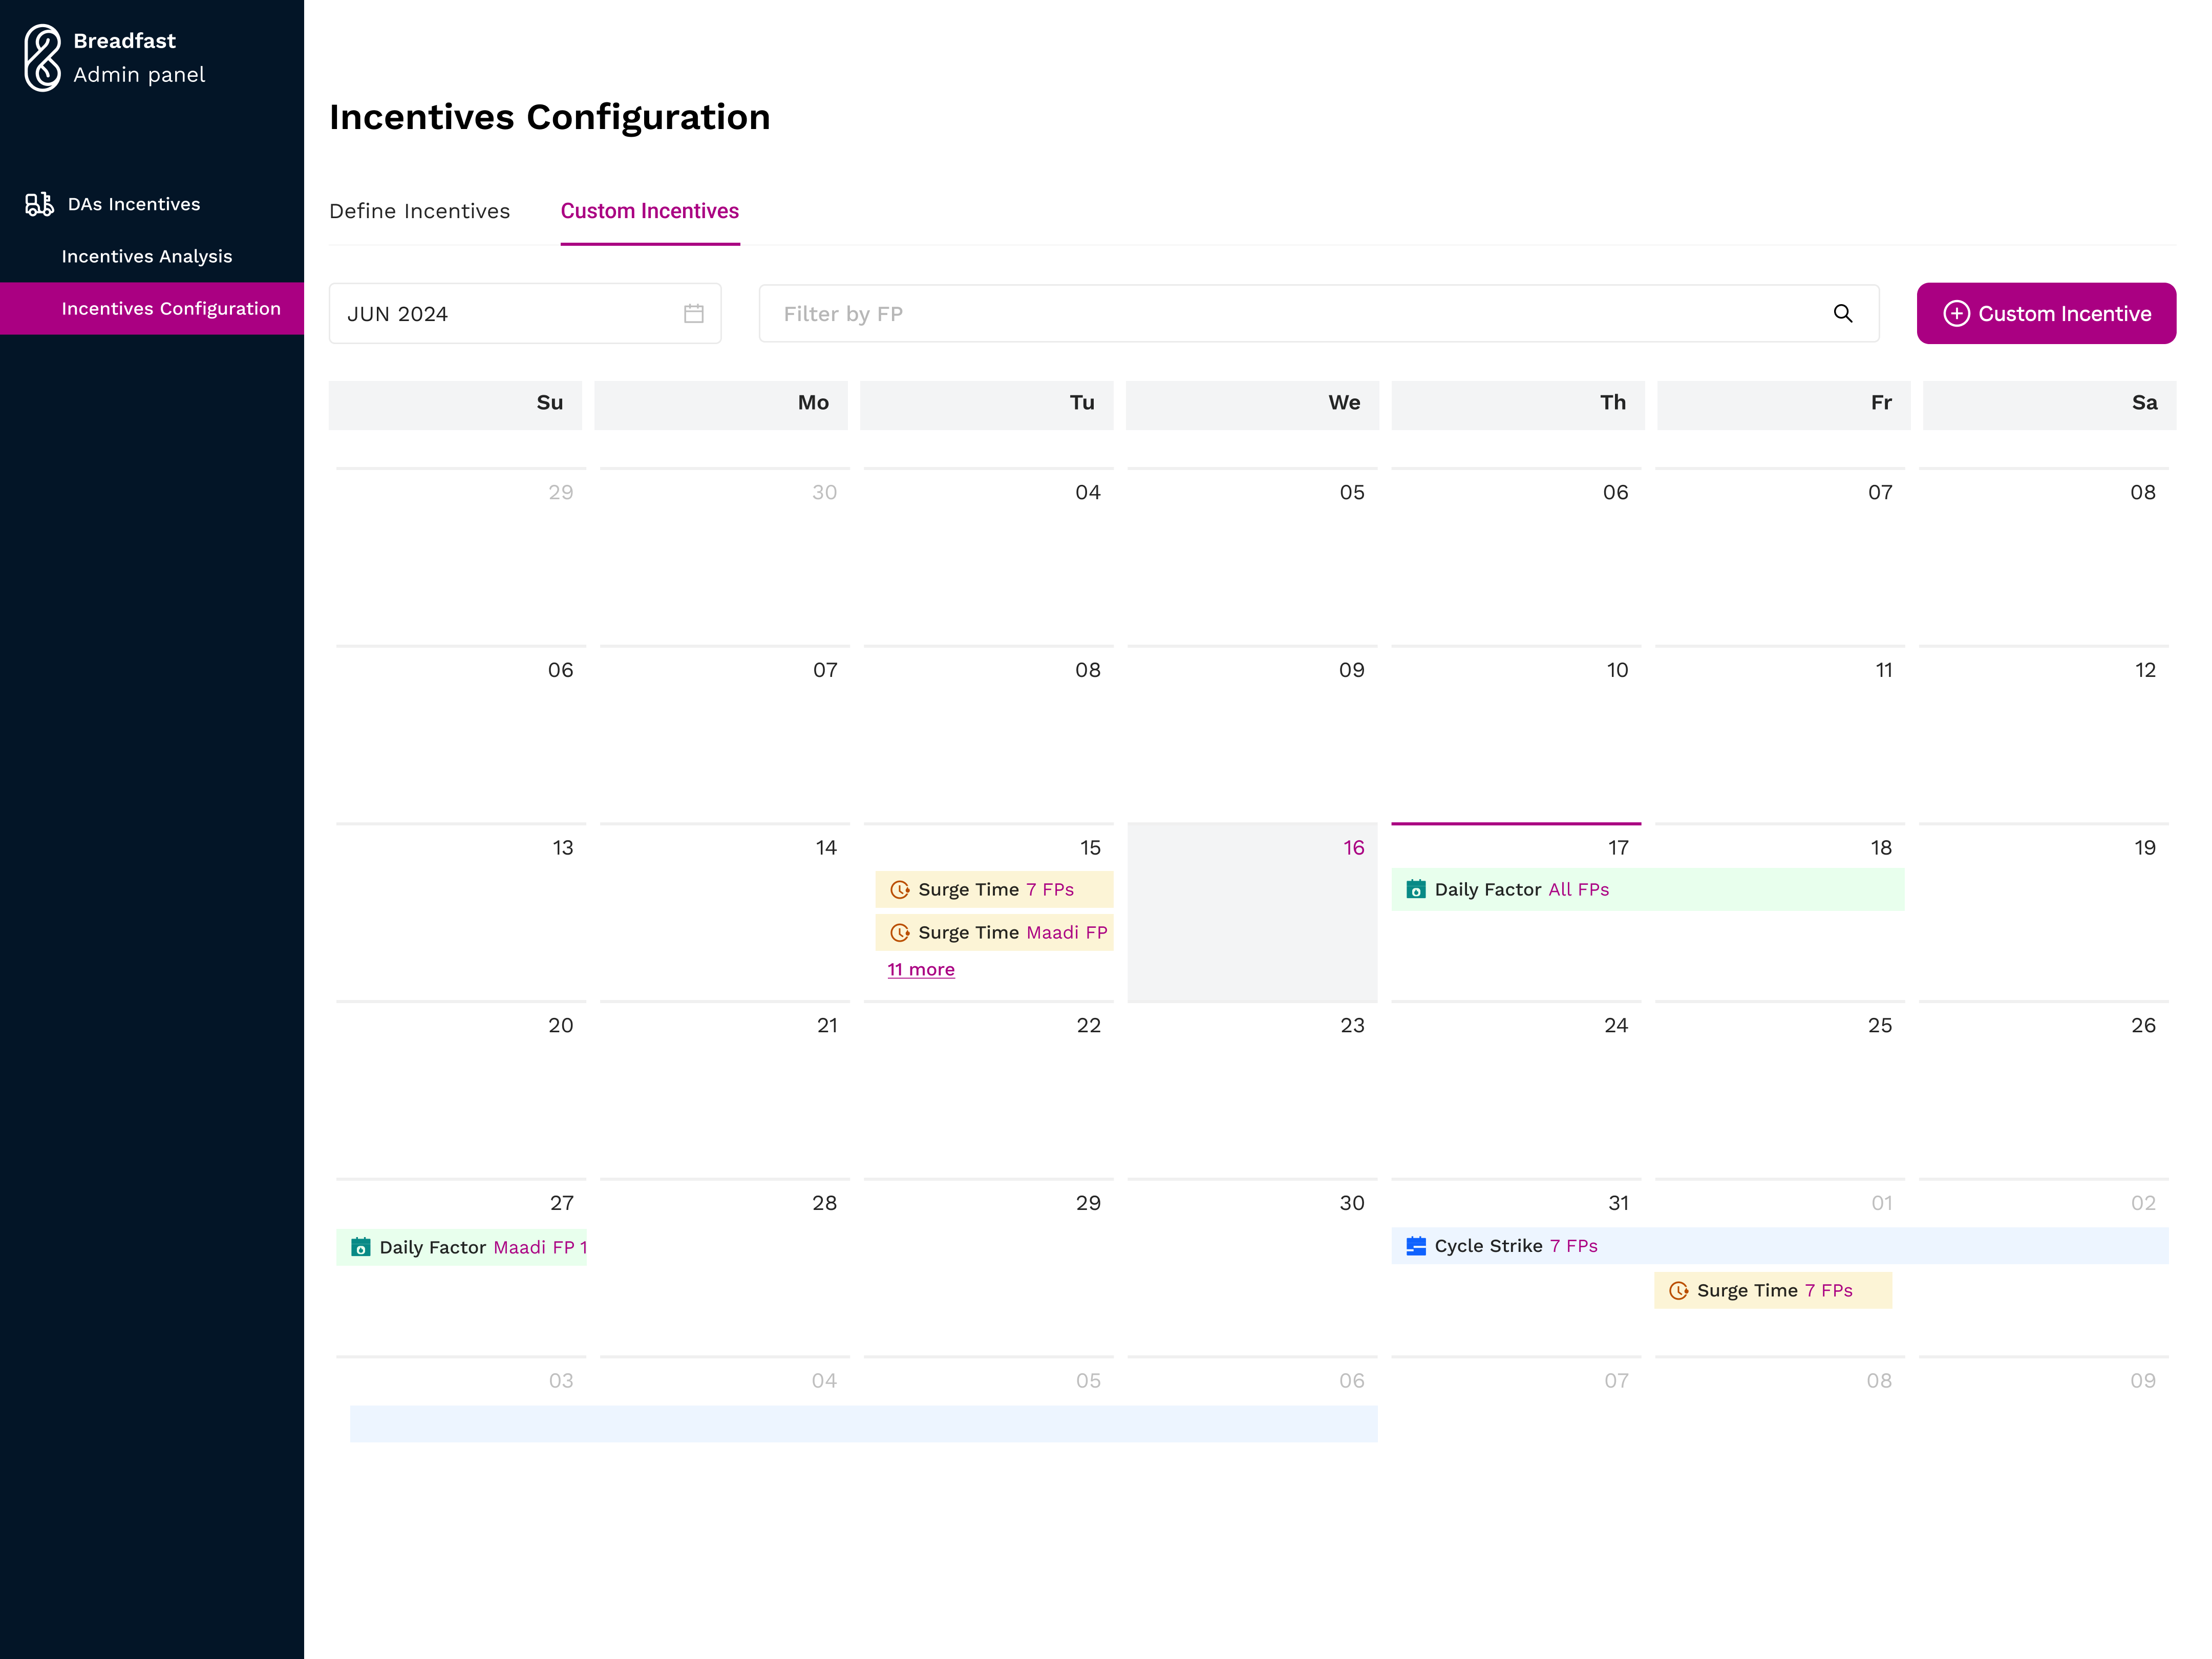
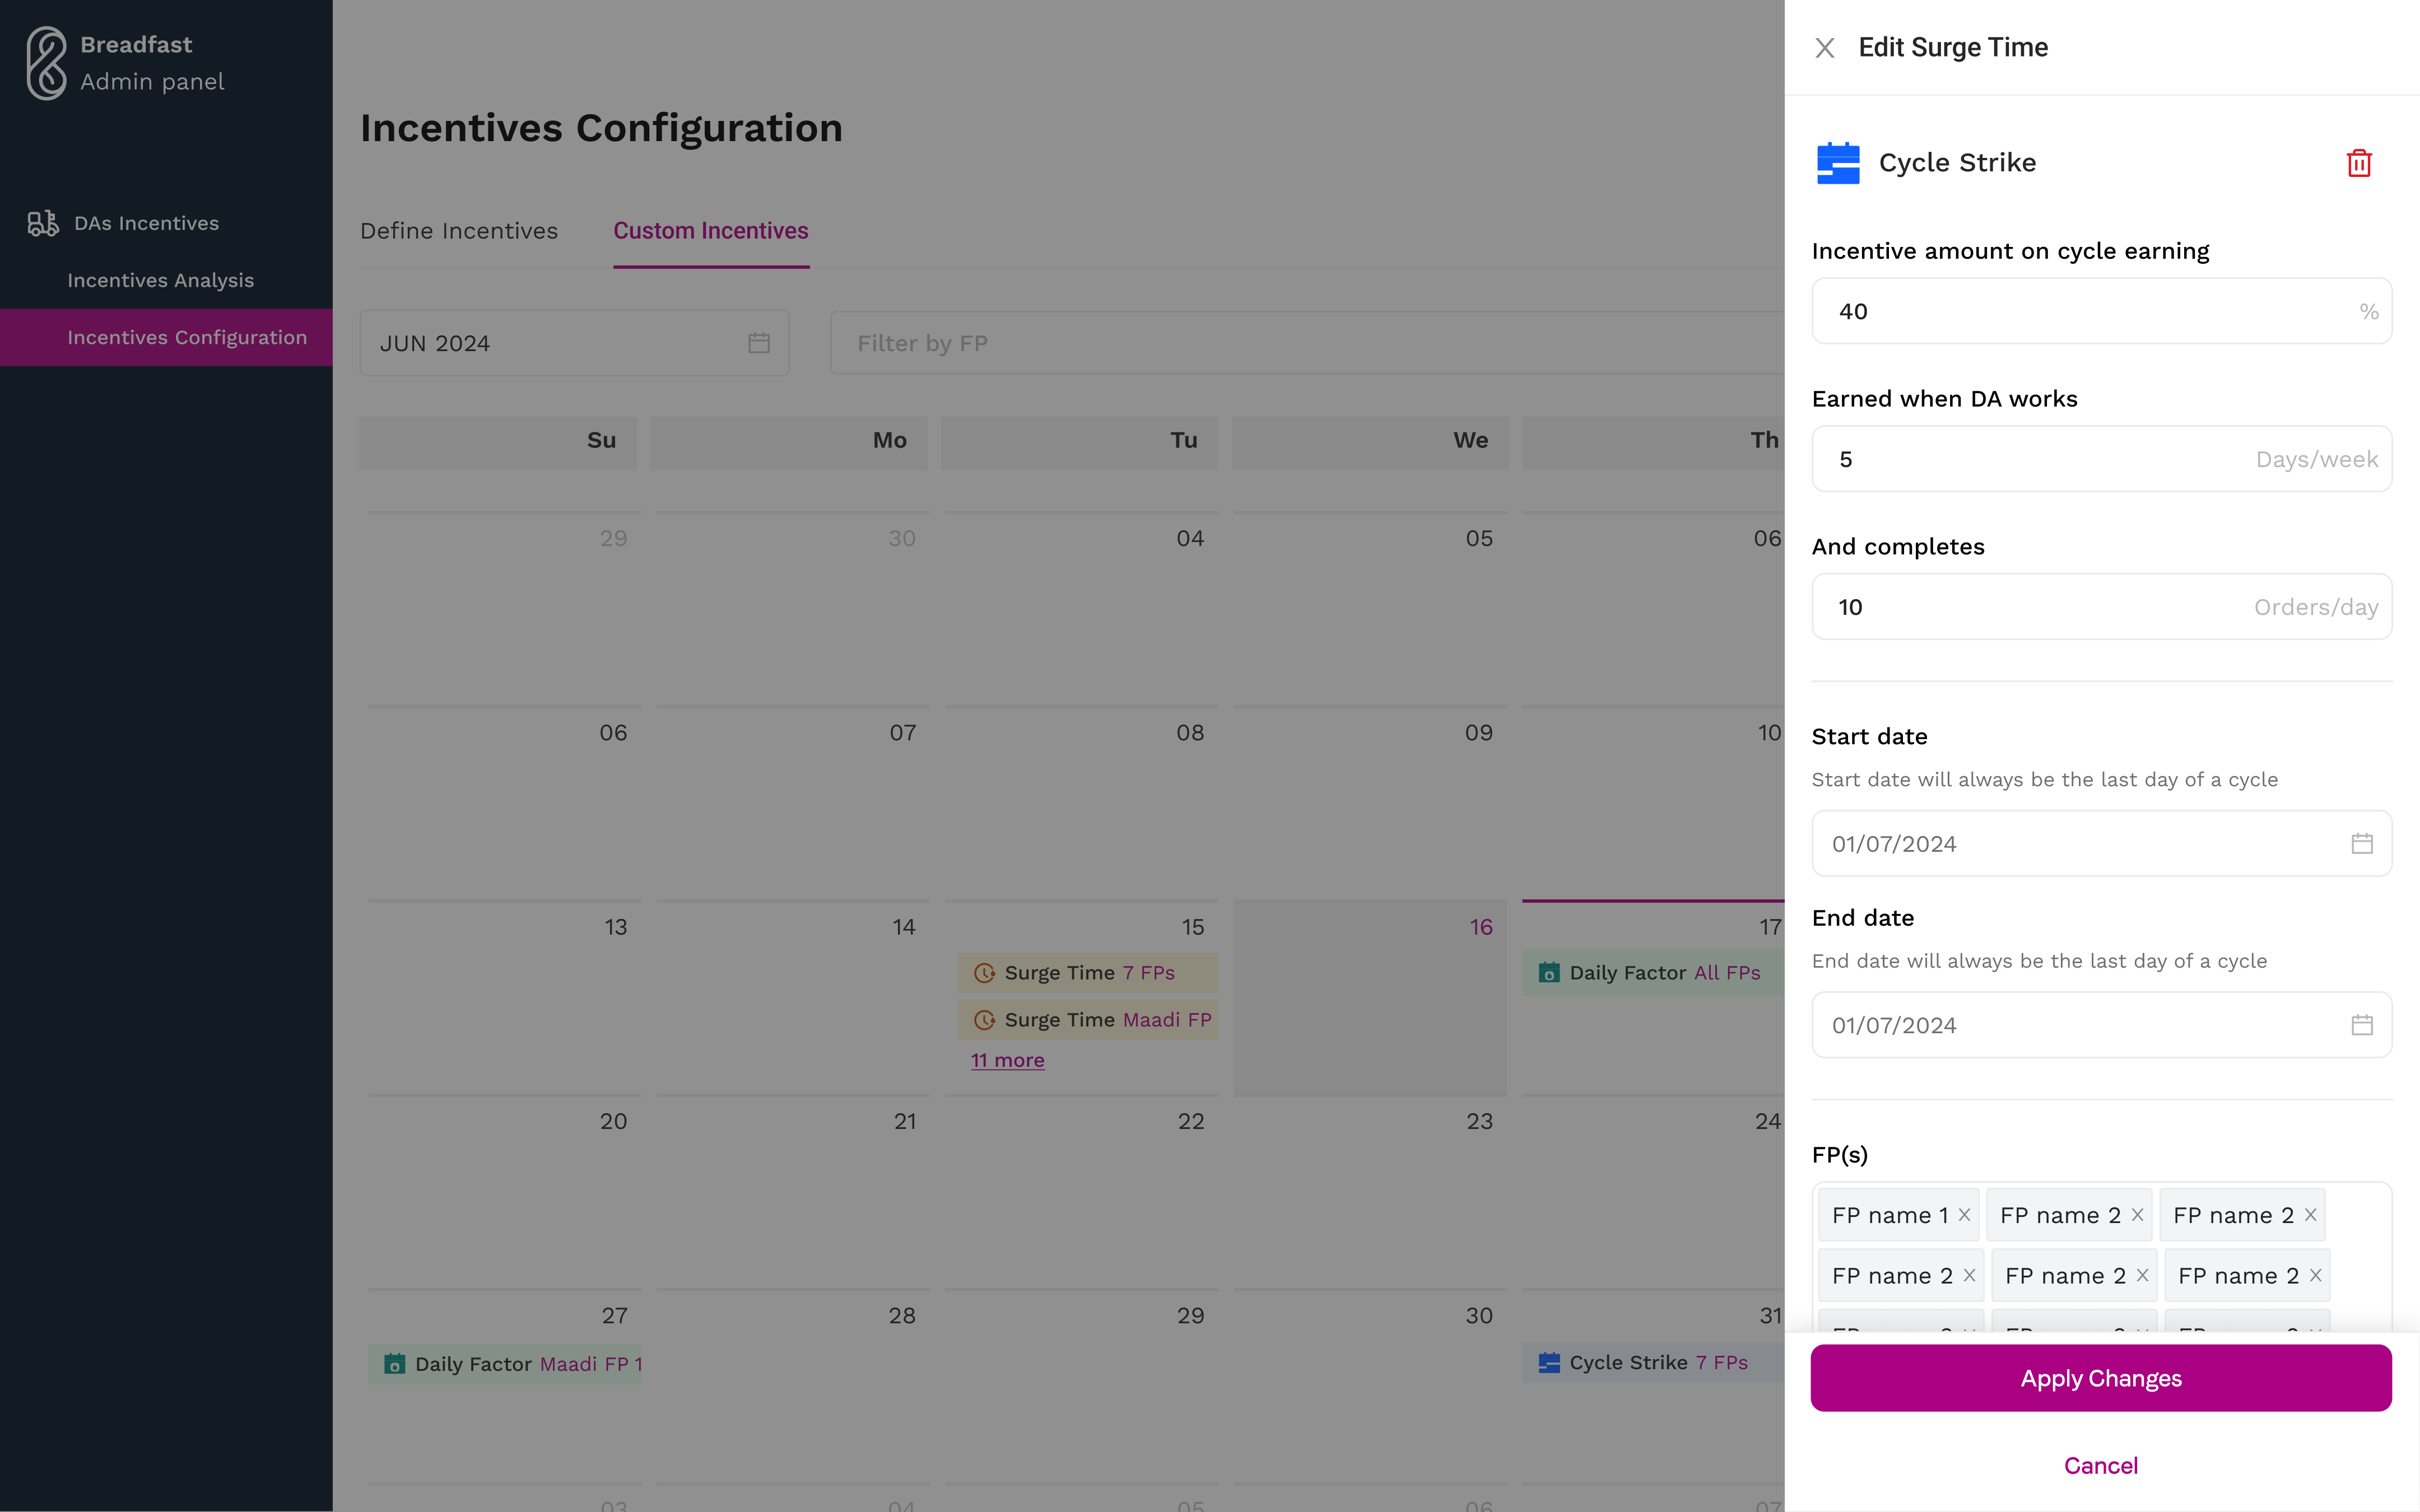
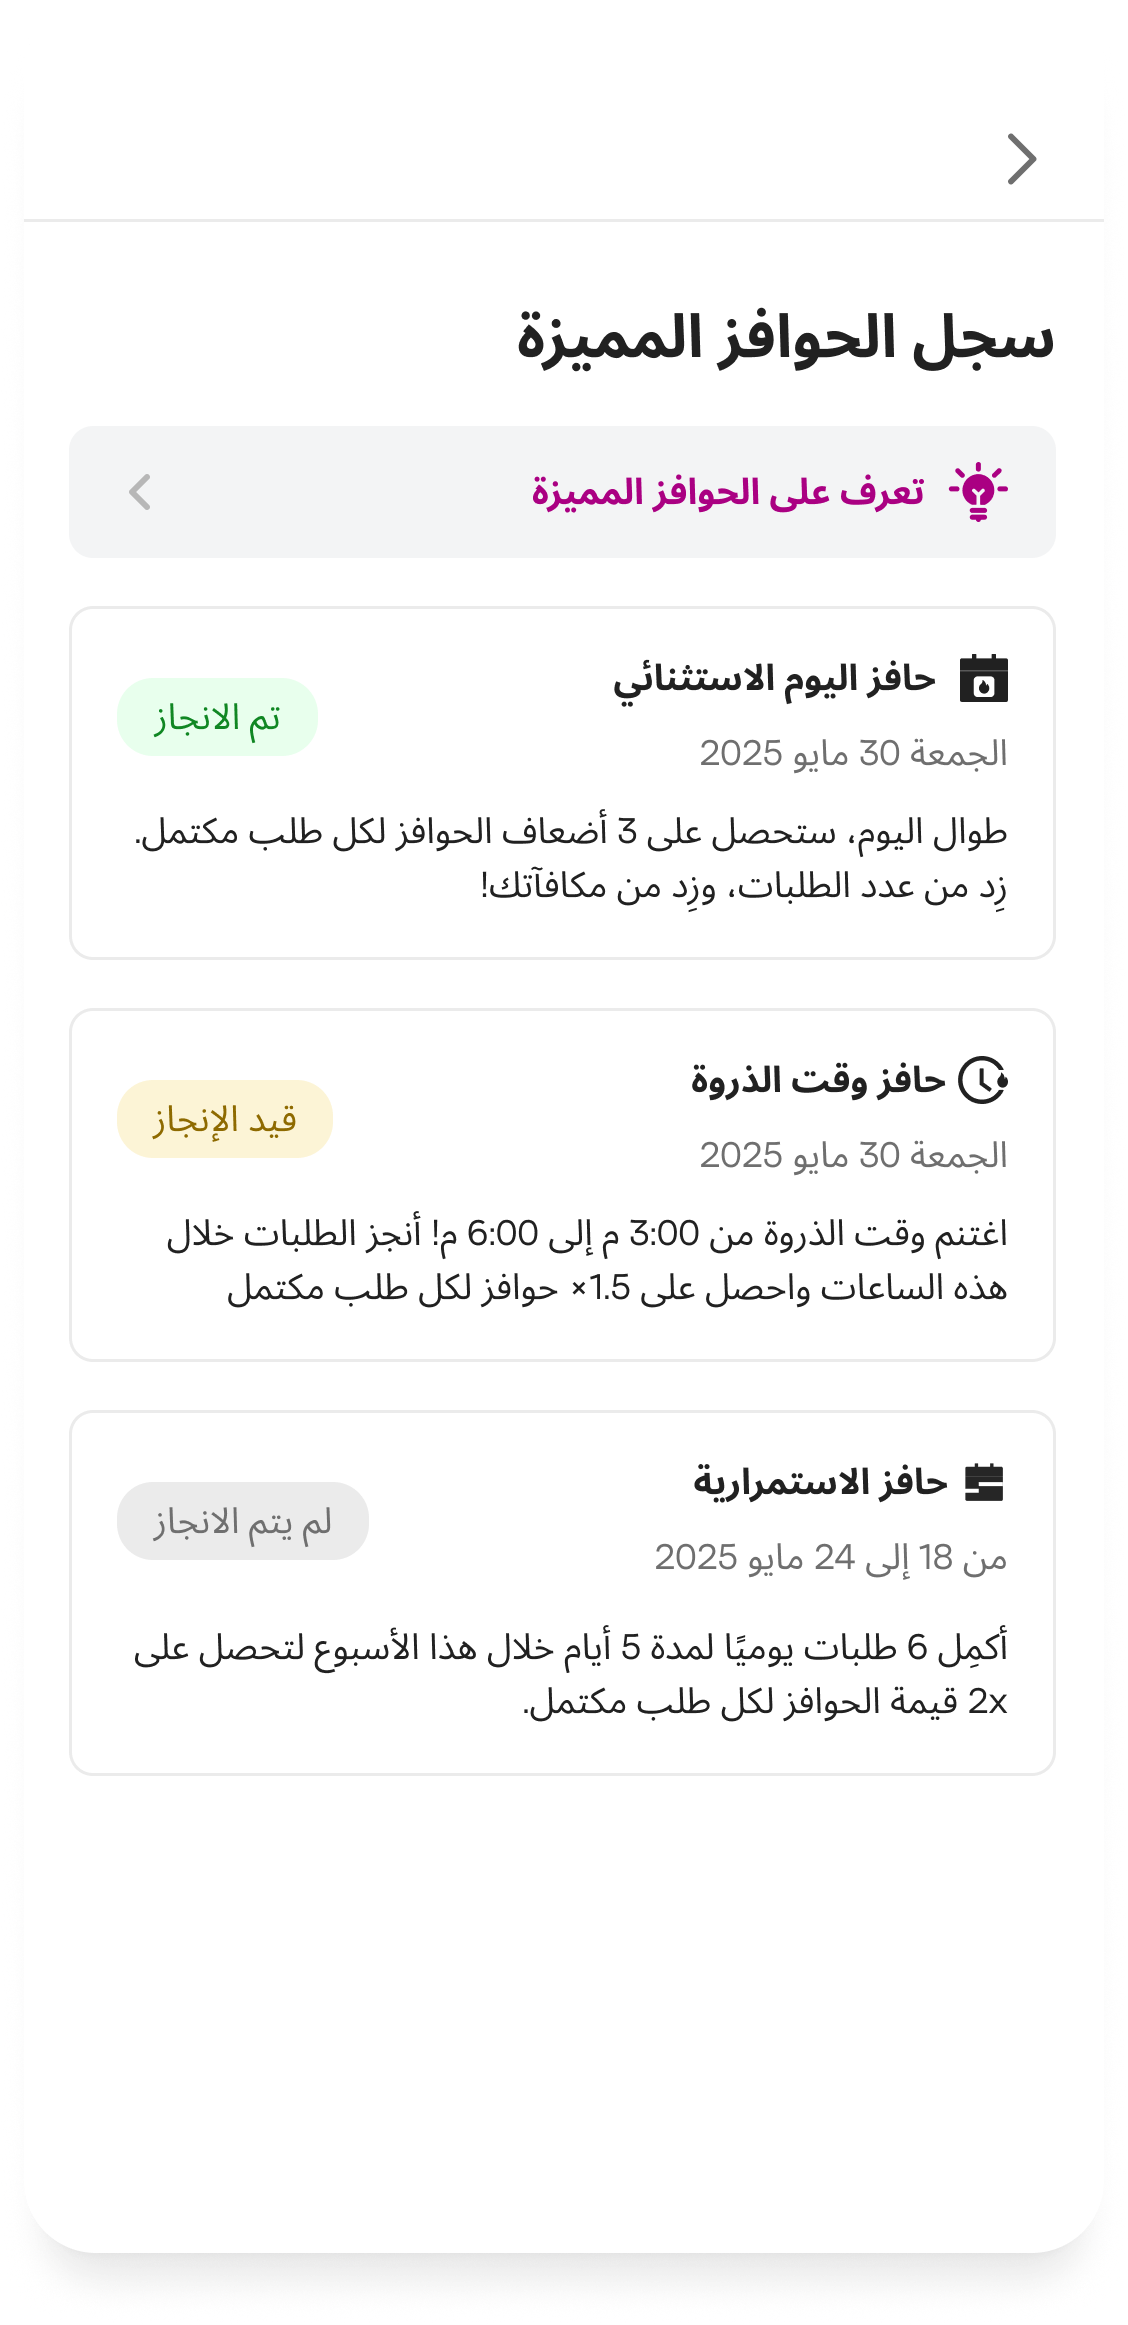
I went back through every custom incentive operations had run and looked for the underlying shapes. They collapsed into three recurring patterns: rewarding consistency across a full cycle, rewarding work during peak demand windows, and boosting a specific exceptional day. I named each one, defined its configuration logic, gave it a mark that works in both English and Arabic, and built the framework so new types could be added later without redesigning the system.
Naming them mattered more than it sounds. Once an incentive had a name and a fixed shape, it could be scheduled on a calendar, rendered in an interface, explained to a DA, and configured by a coordinator without an engineer. Before that, it was a private arrangement.
( 05 · Working it out )
Why two rollouts instead of one
The system was too large to ship in a single release, which made the sequencing a real decision rather than a formality.
I put the coordinator dashboard first because it was the foundational building block. The DA facing app needed a working configuration layer underneath it before it could reliably show anyone anything. Without that, we would have been surfacing the same unreliable numbers, faster.
It also paid off during the gap between releases. DAs could still do what they had always done: walk up to a coordinator and ask about their pay. What changed immediately was the coordinator's answer, faster and correct. The trust problem started closing before the DAs ever saw a screen.
( 06 · Rollout 1 )
The operations dashboard
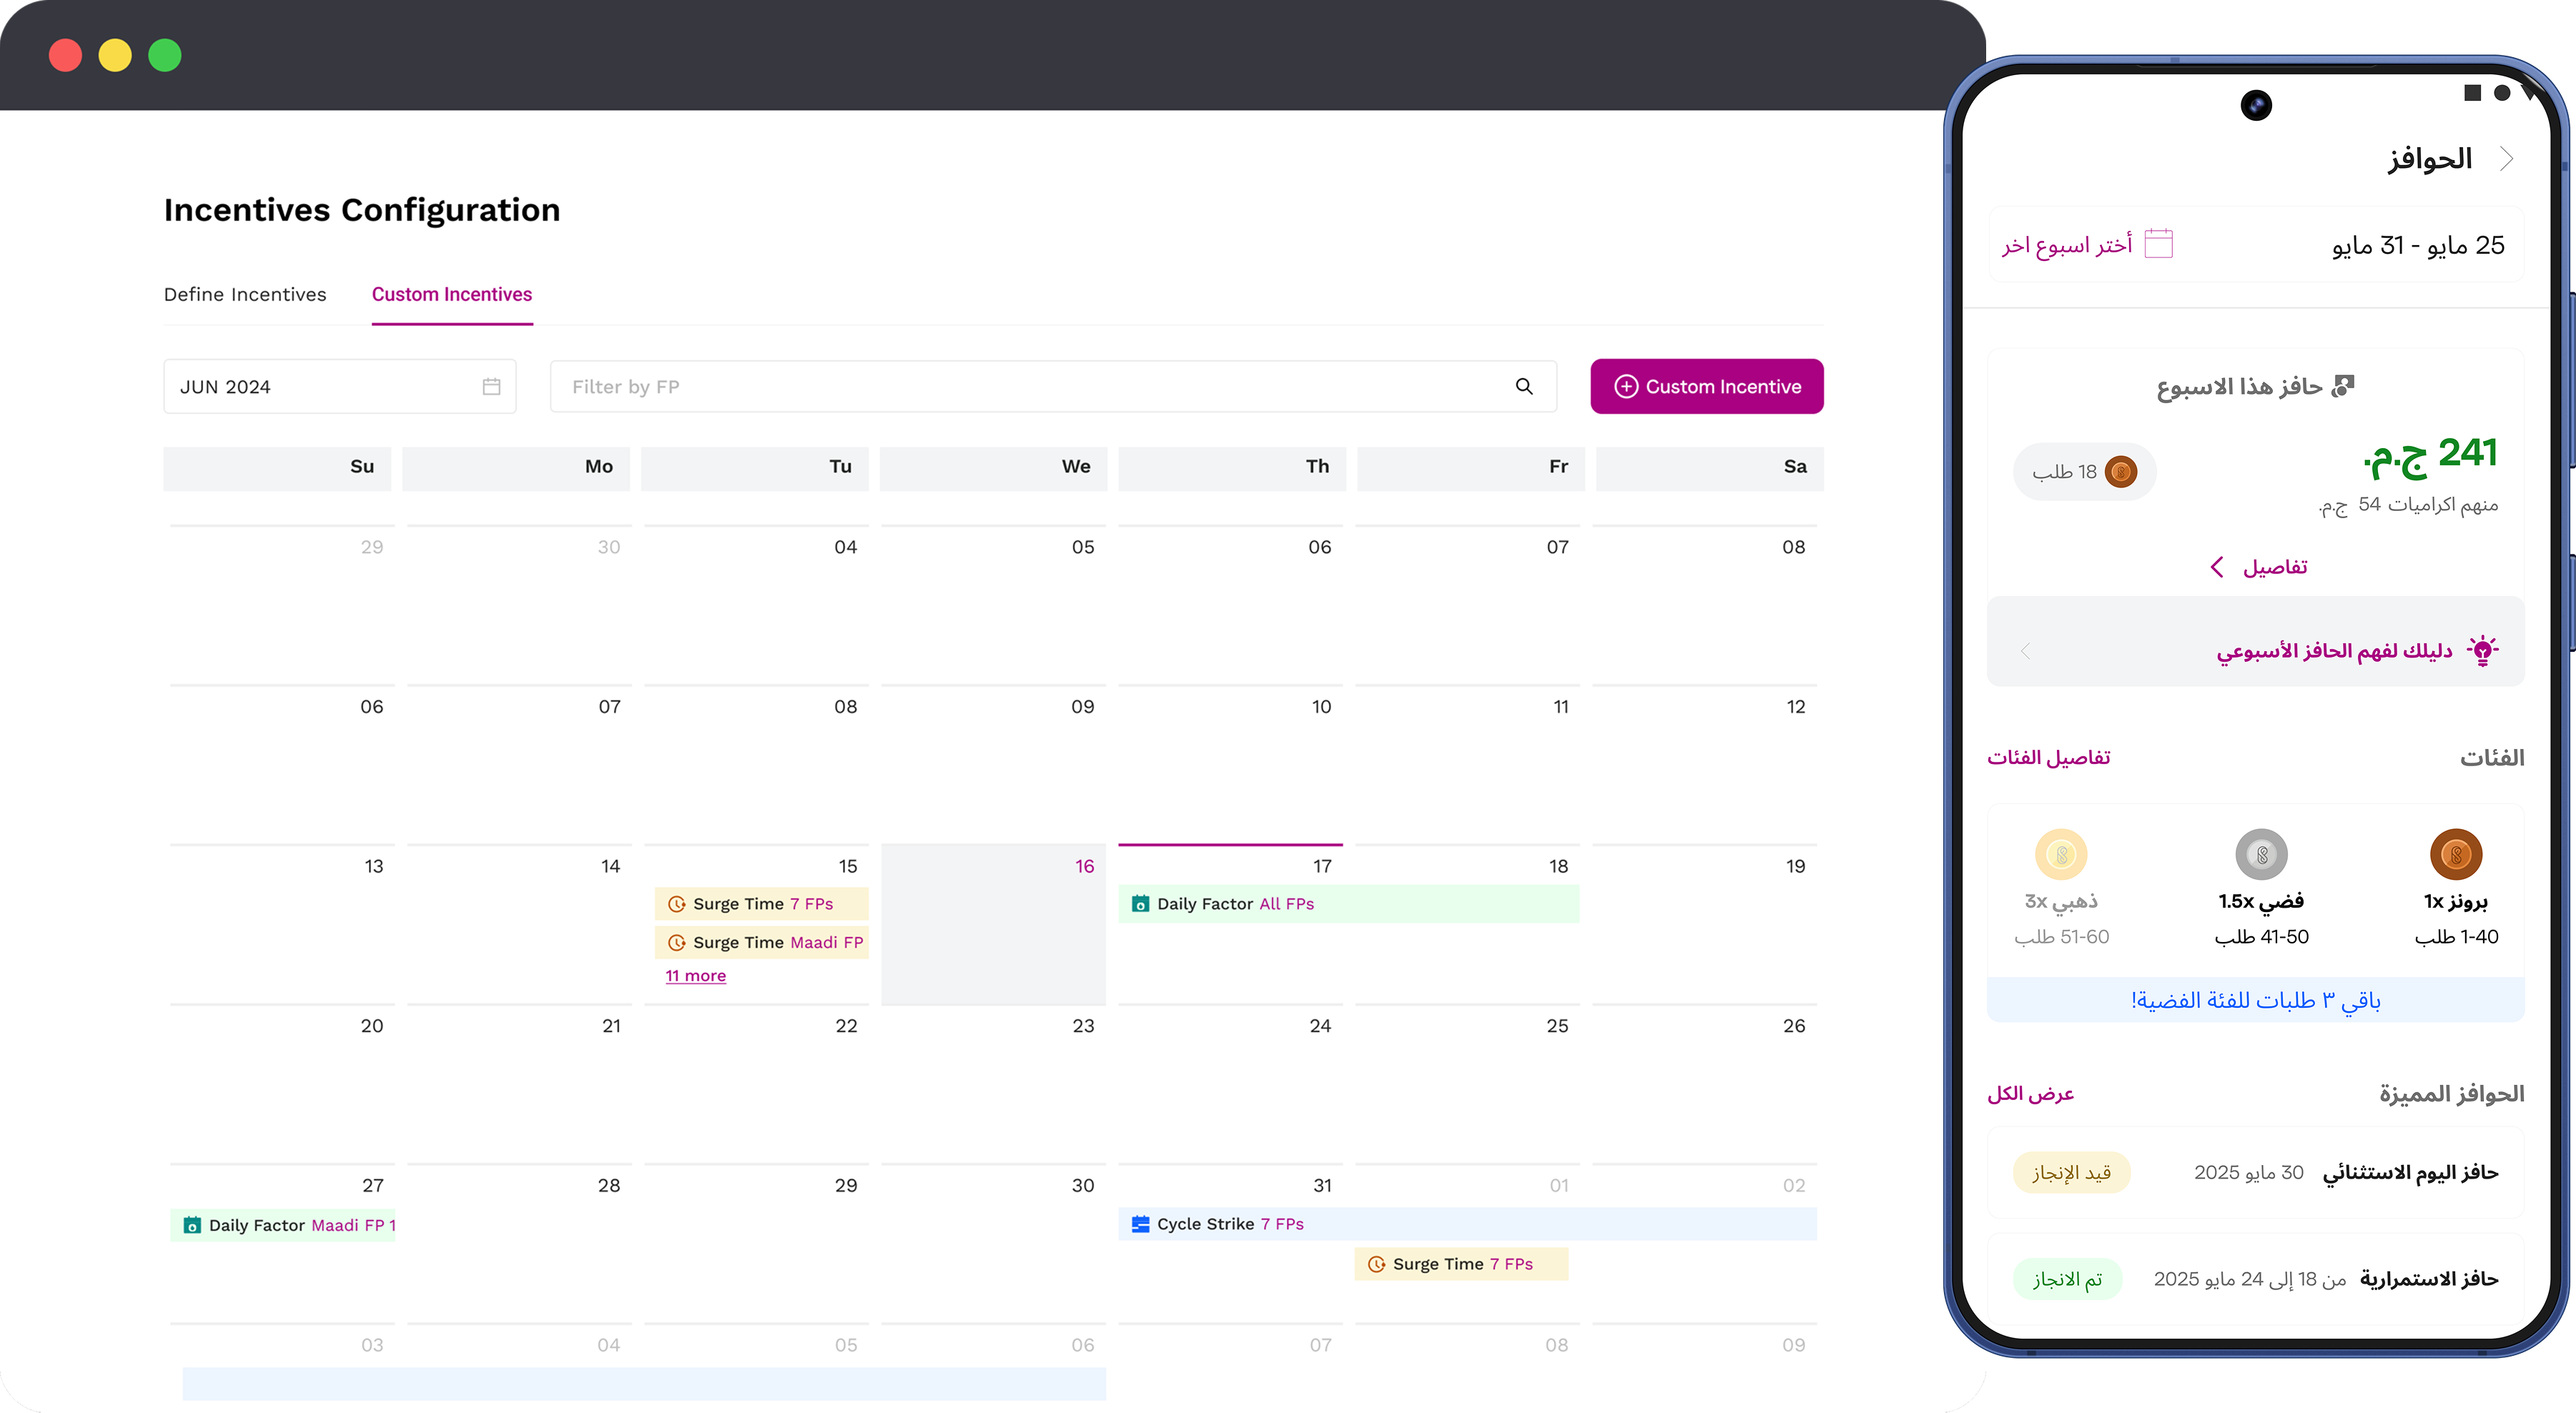
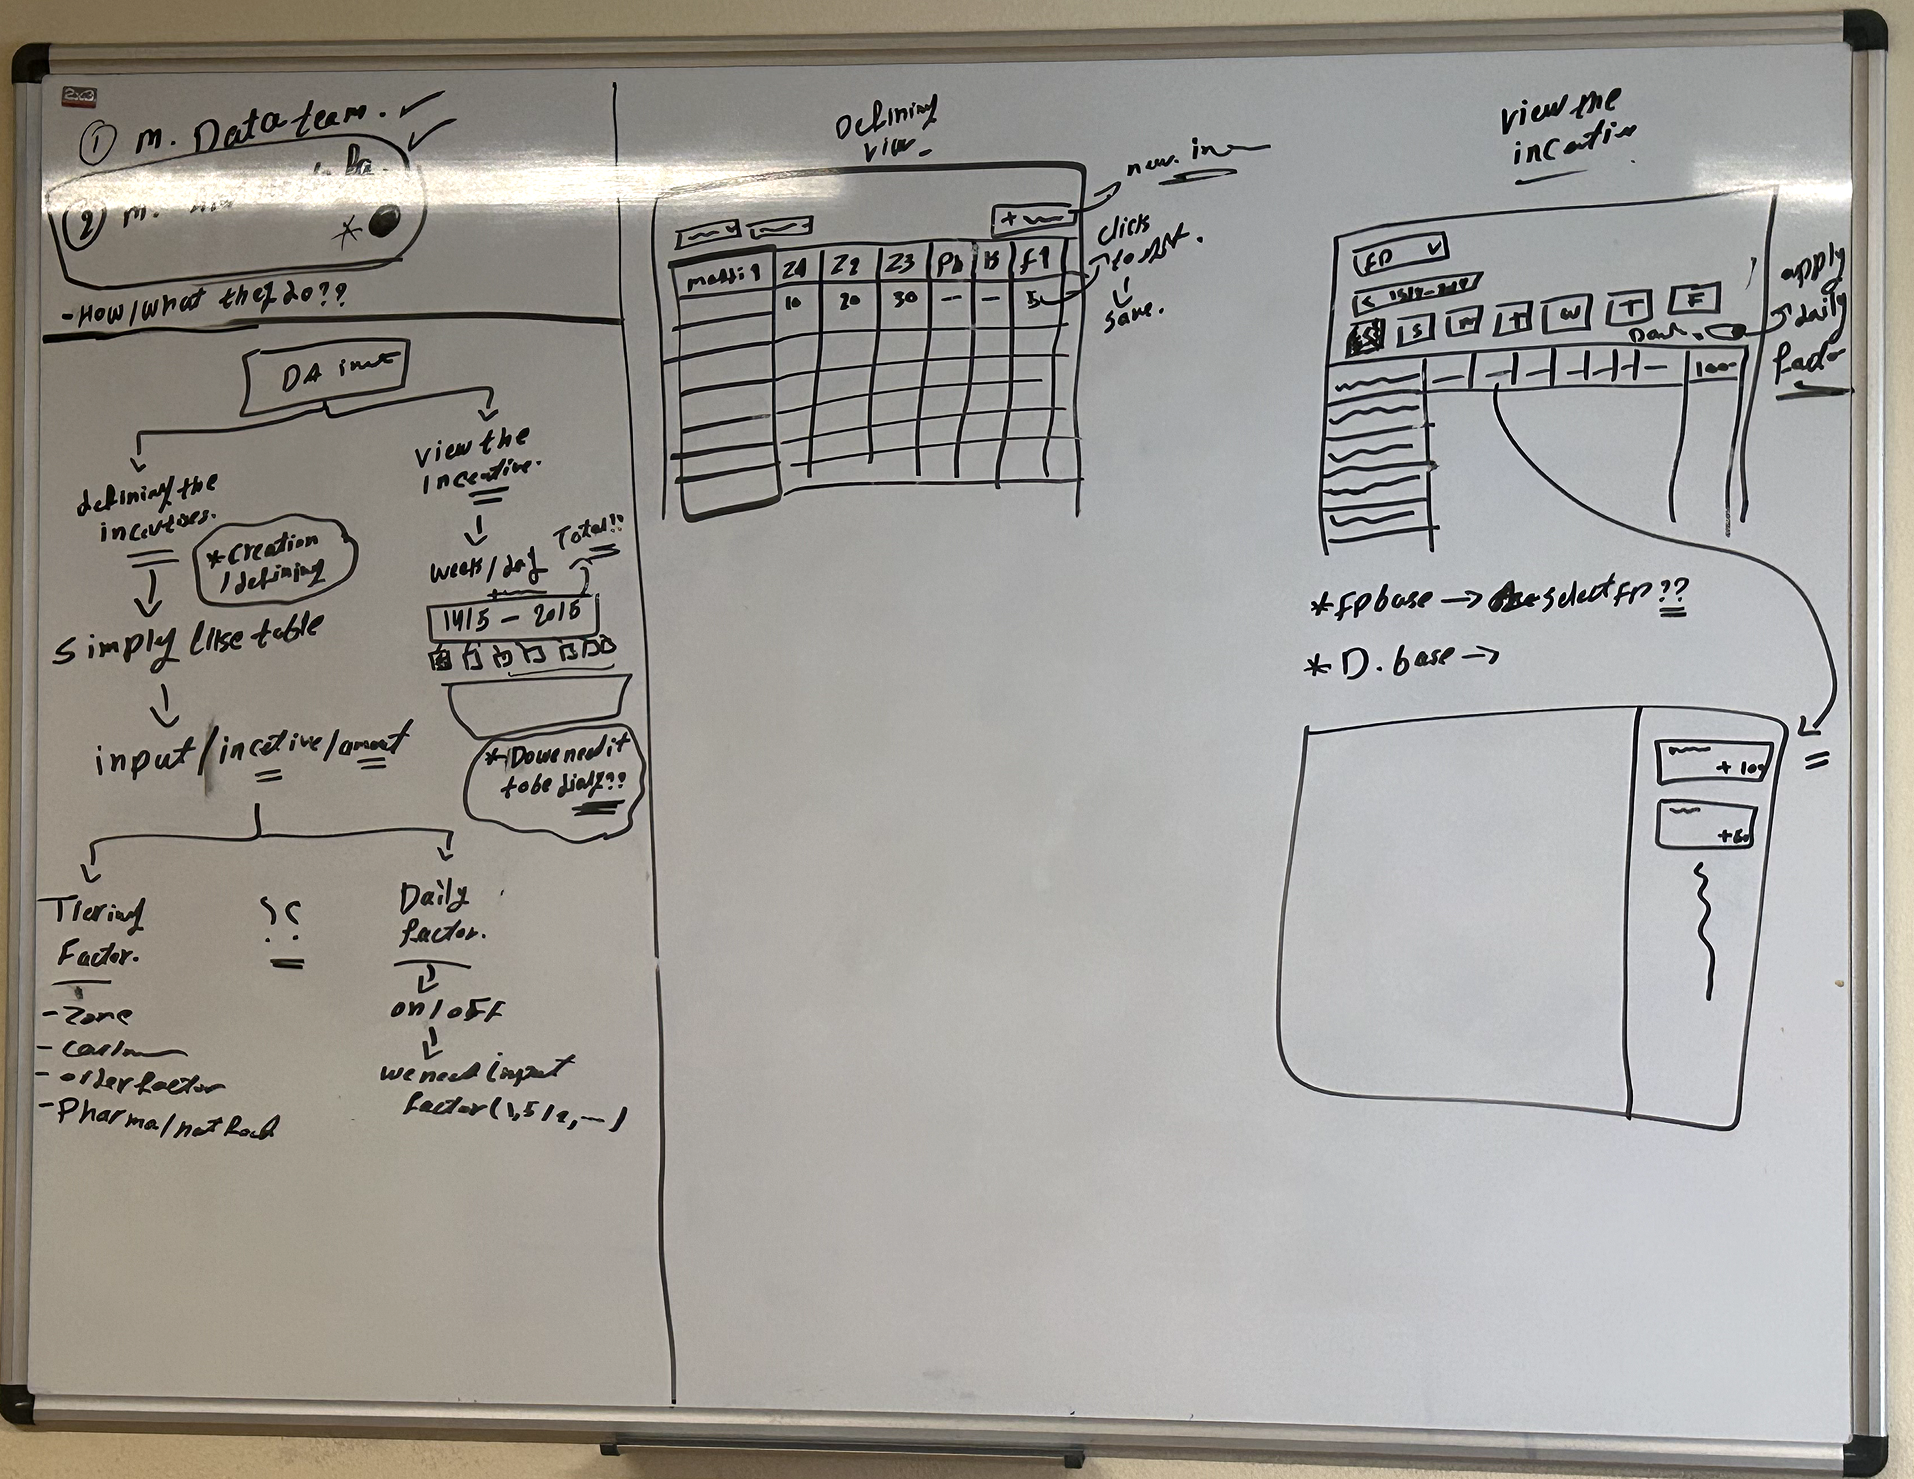
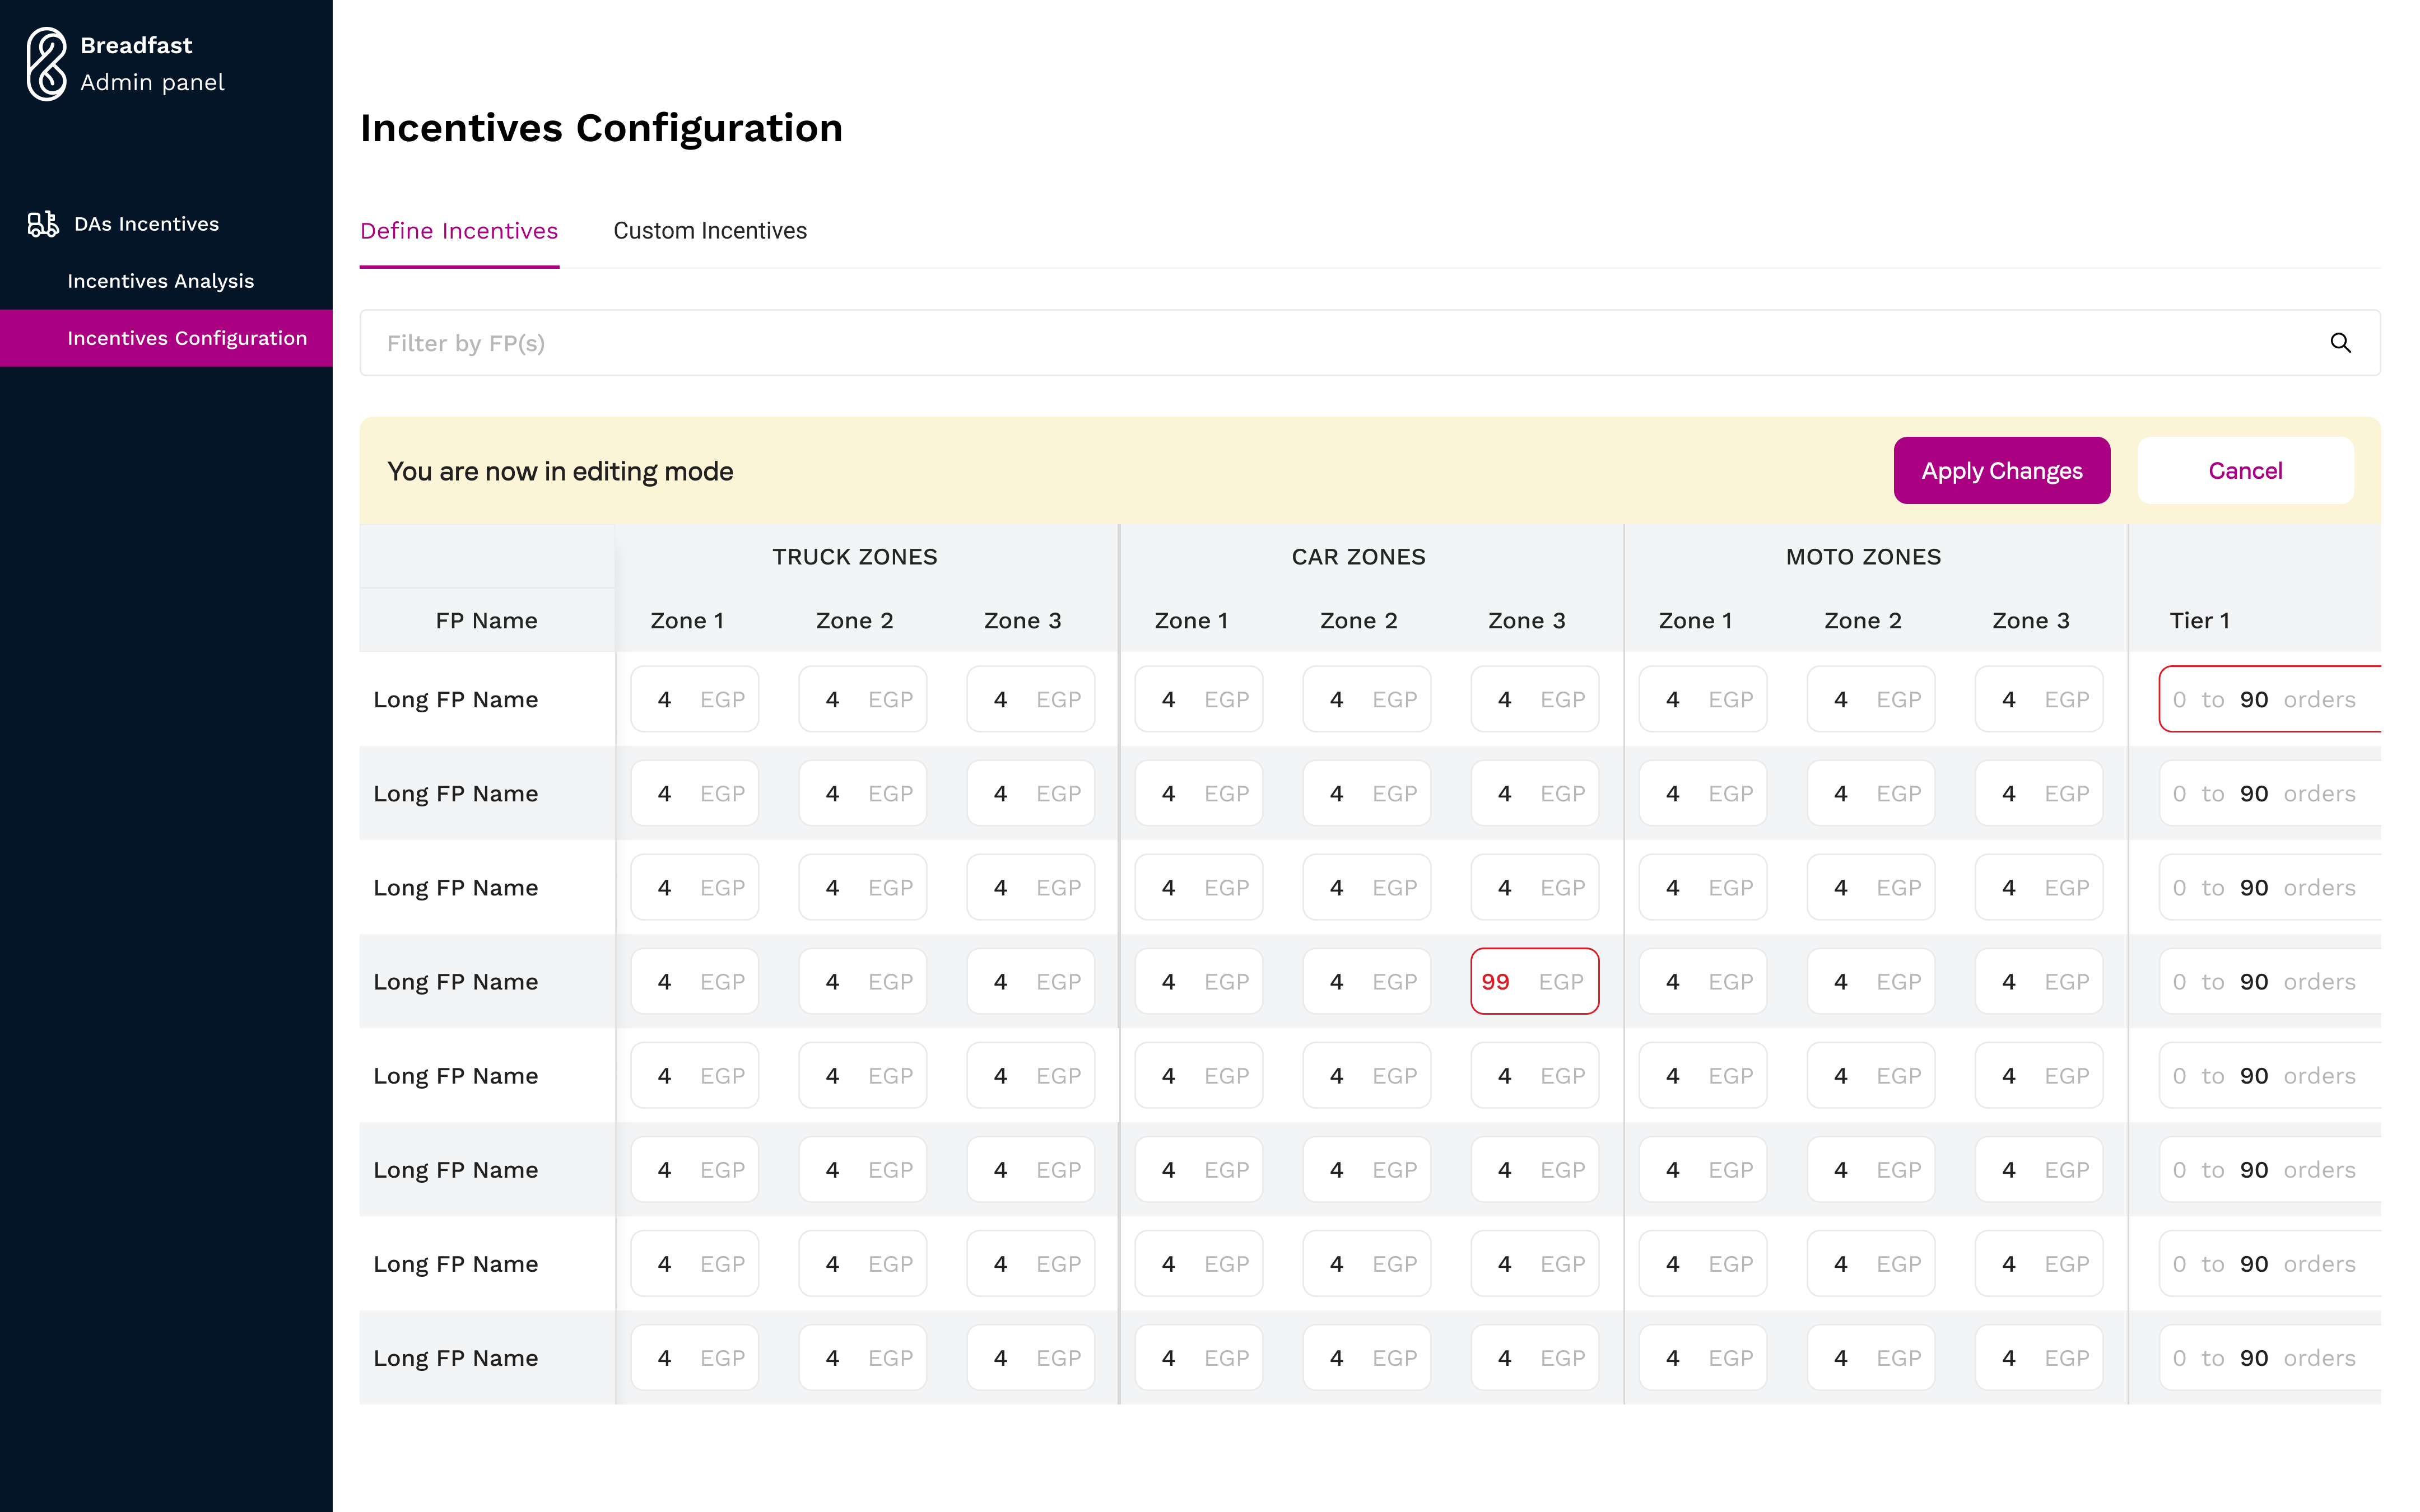
The first rollout was entirely ops facing. I designed a dedicated incentives management system inside the existing coordinator dashboard, the same space coordinators already used for every other operational task, rather than a new tool to learn.
It replaced the spreadsheet. Coordinators could now view and modify all DA incentive configurations, across every incentive type and vehicle type, without raising an engineering ticket.
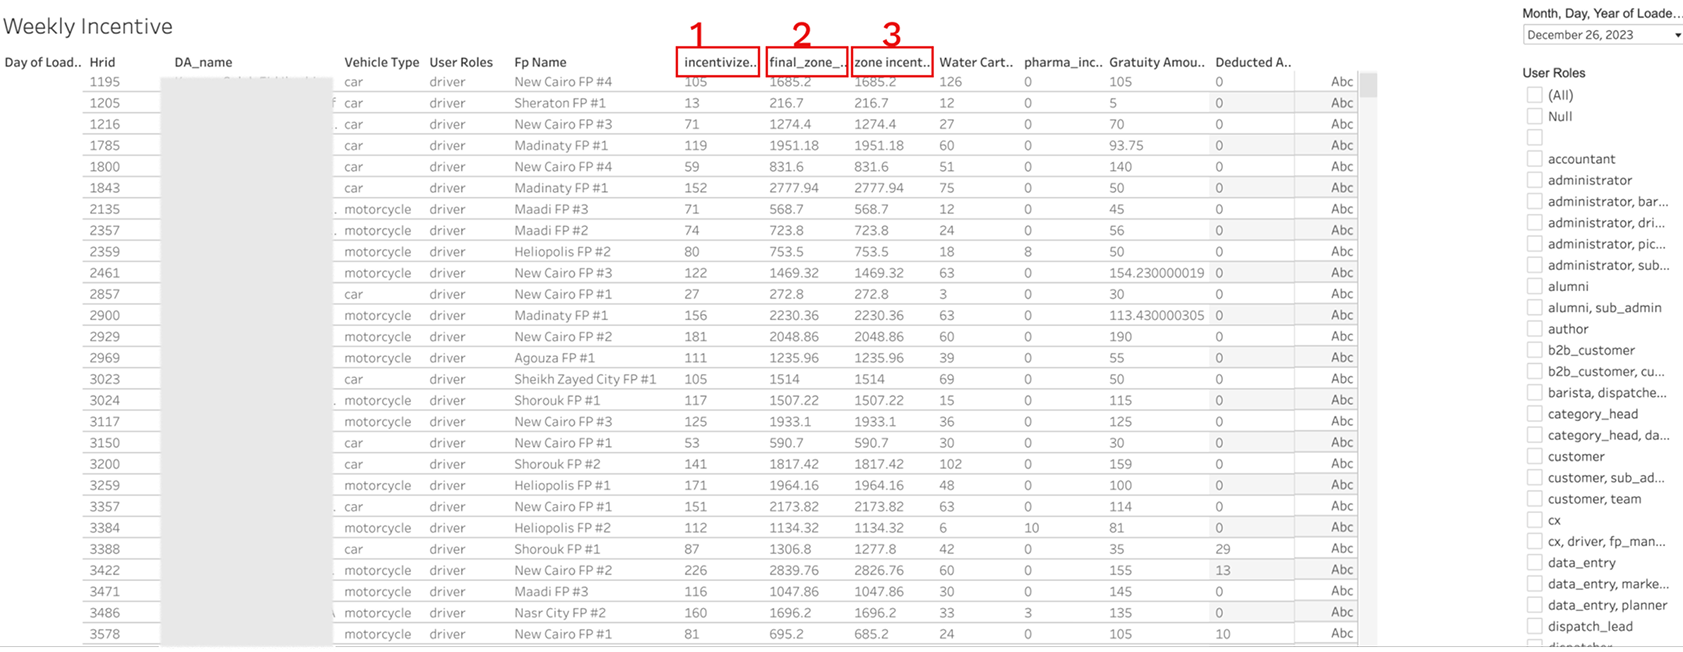
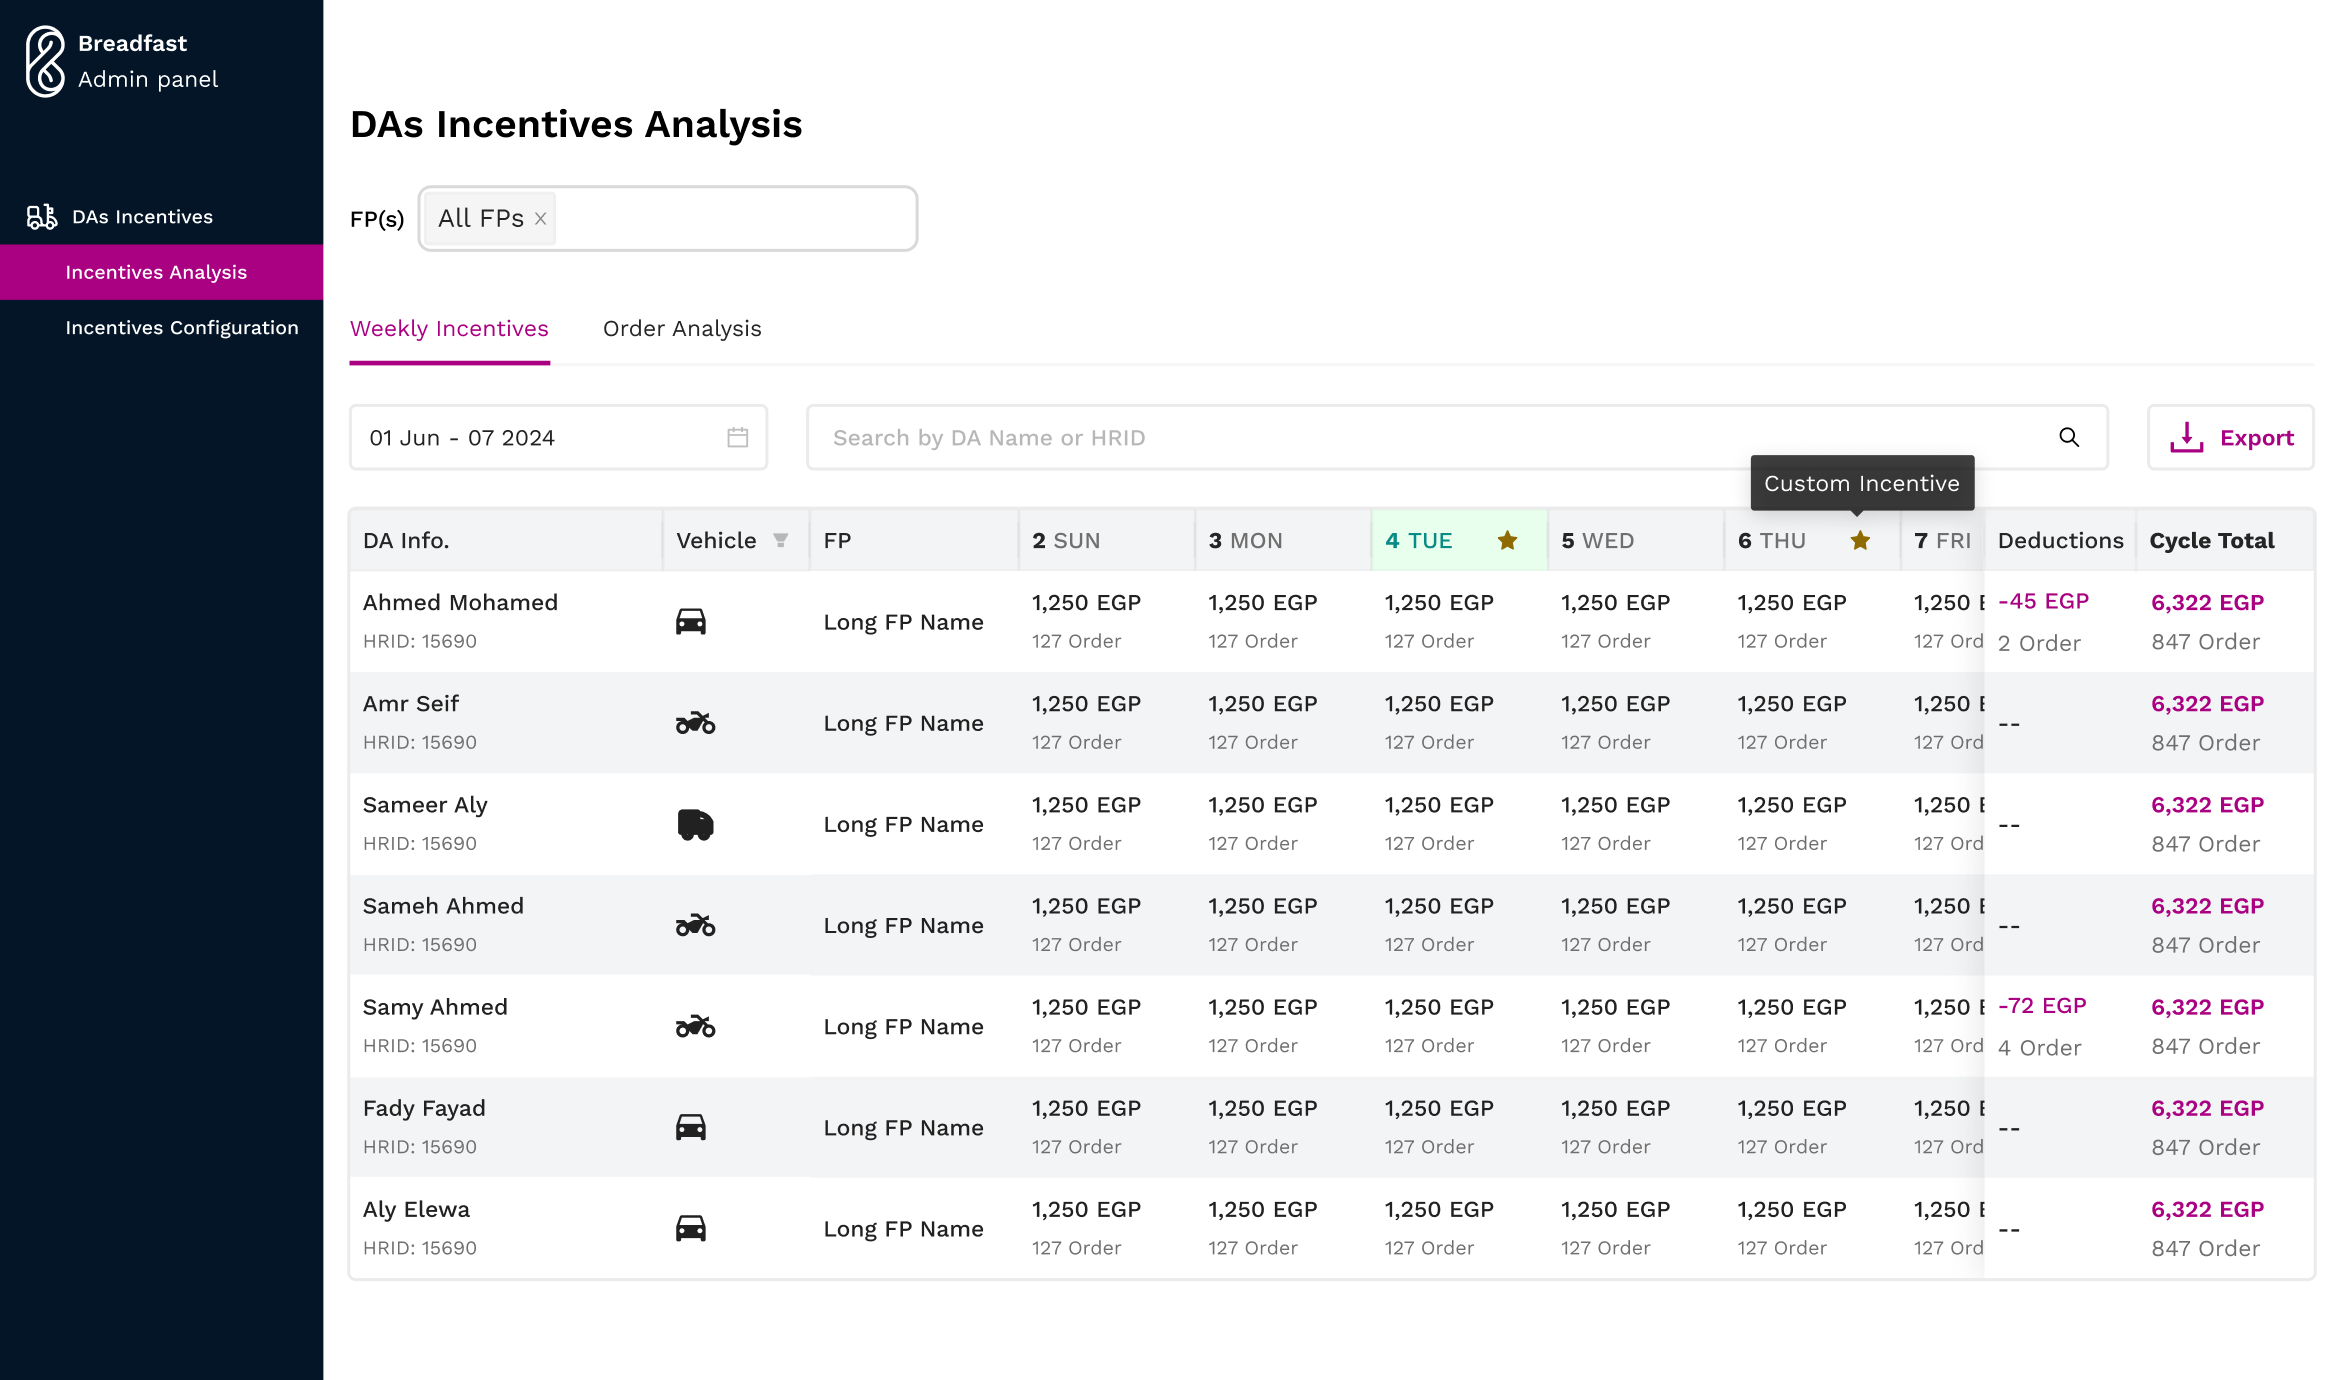
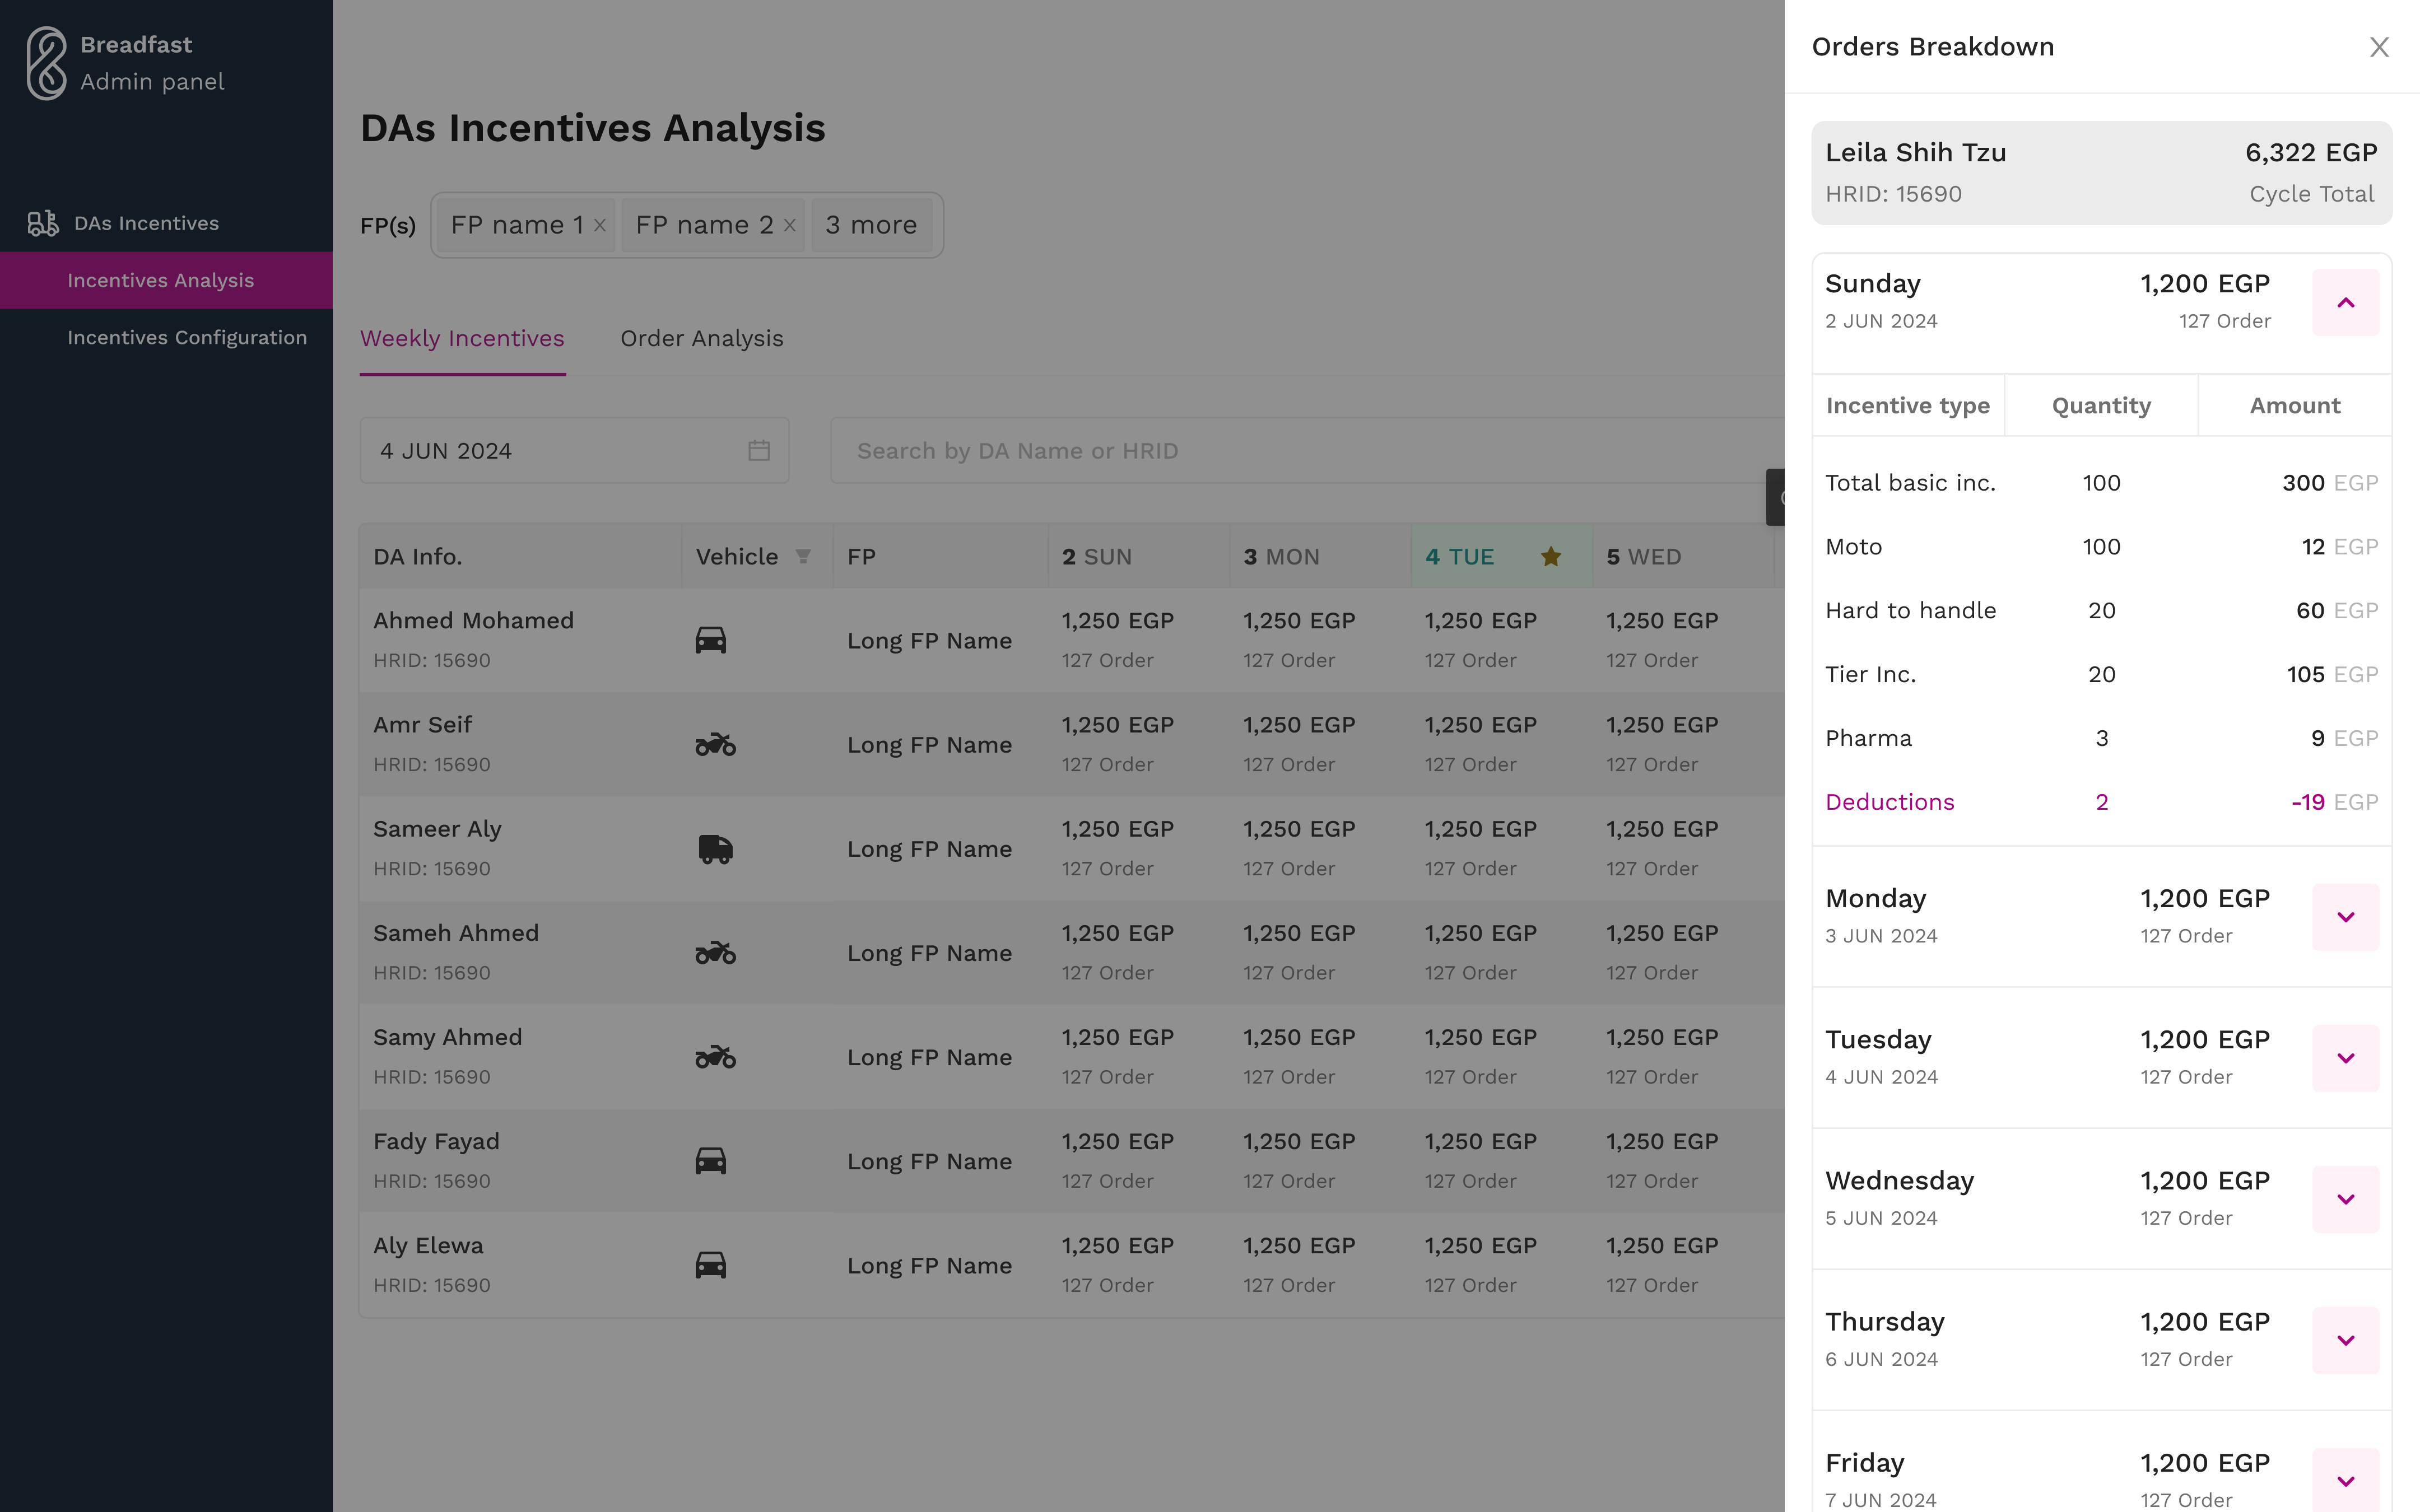
Incentives Analysis gives them the read: each DA as a row, the cycle across the top, deductions and cycle total on the end, and a star on any day carrying a custom incentive. A second tab reframes the same data by order, showing what each one's incentive actually cost Breadfast.
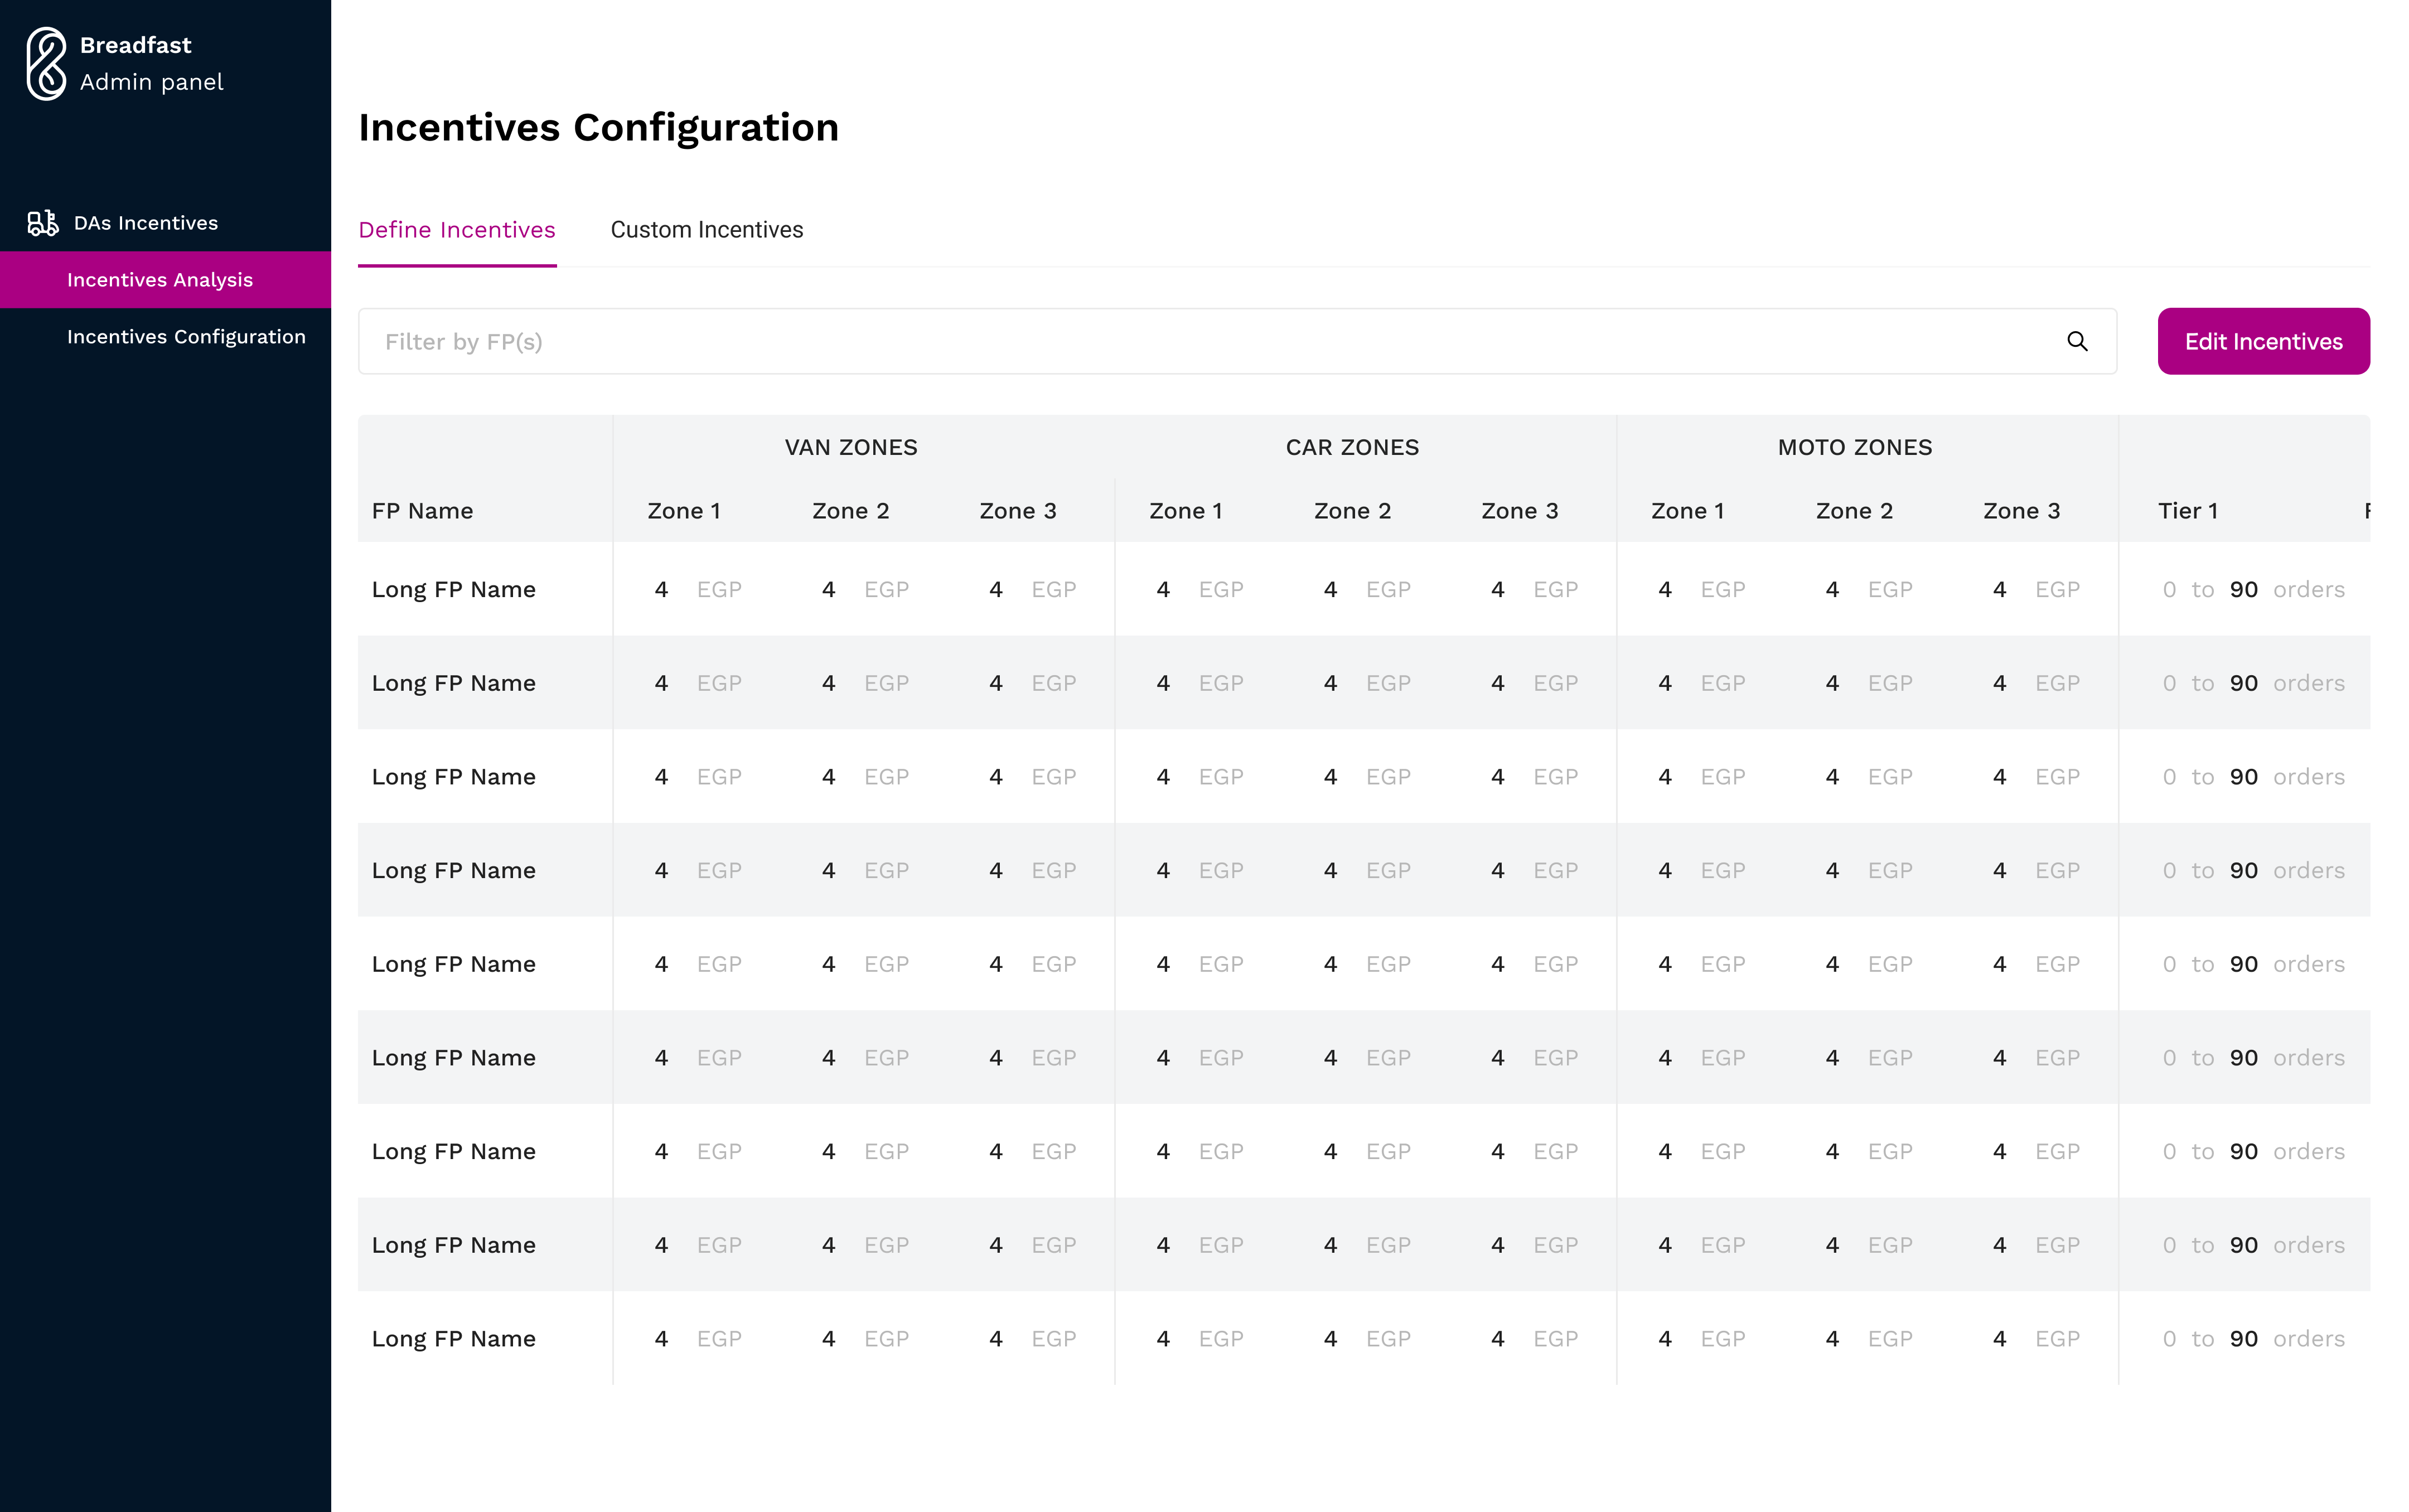
Incentives Configuration gives them the write. Named incentive types placed on a calendar, scoped to individual fulfilment points or all of them, set by a coordinator in minutes.
( 07 · Rollout 2 )
The DA facing Fleet App
The second rollout gave Delivery Associates what they had always needed: full transparency into their own earnings, live.
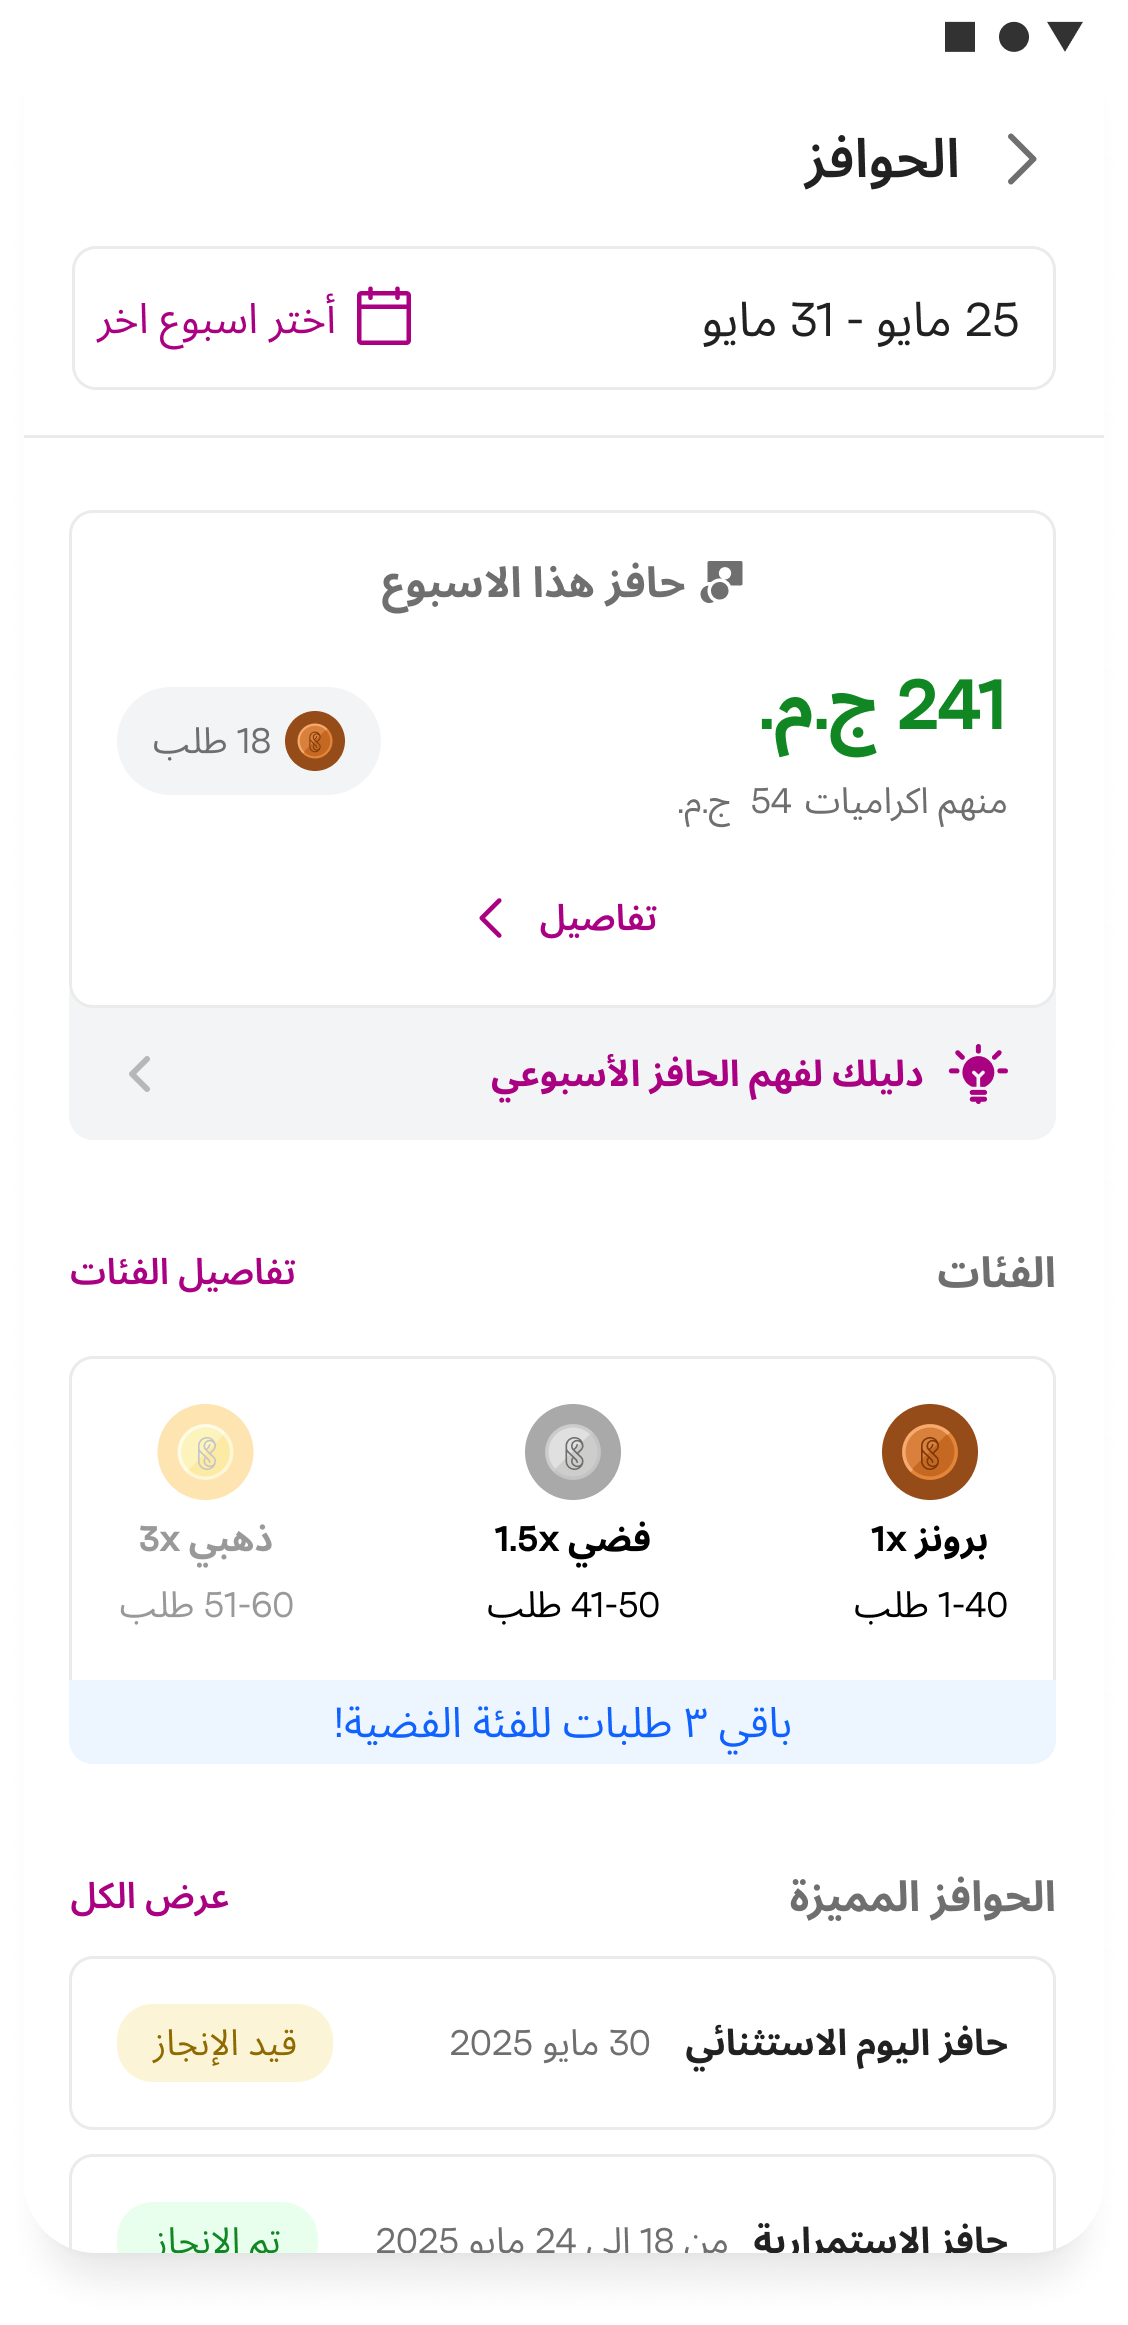
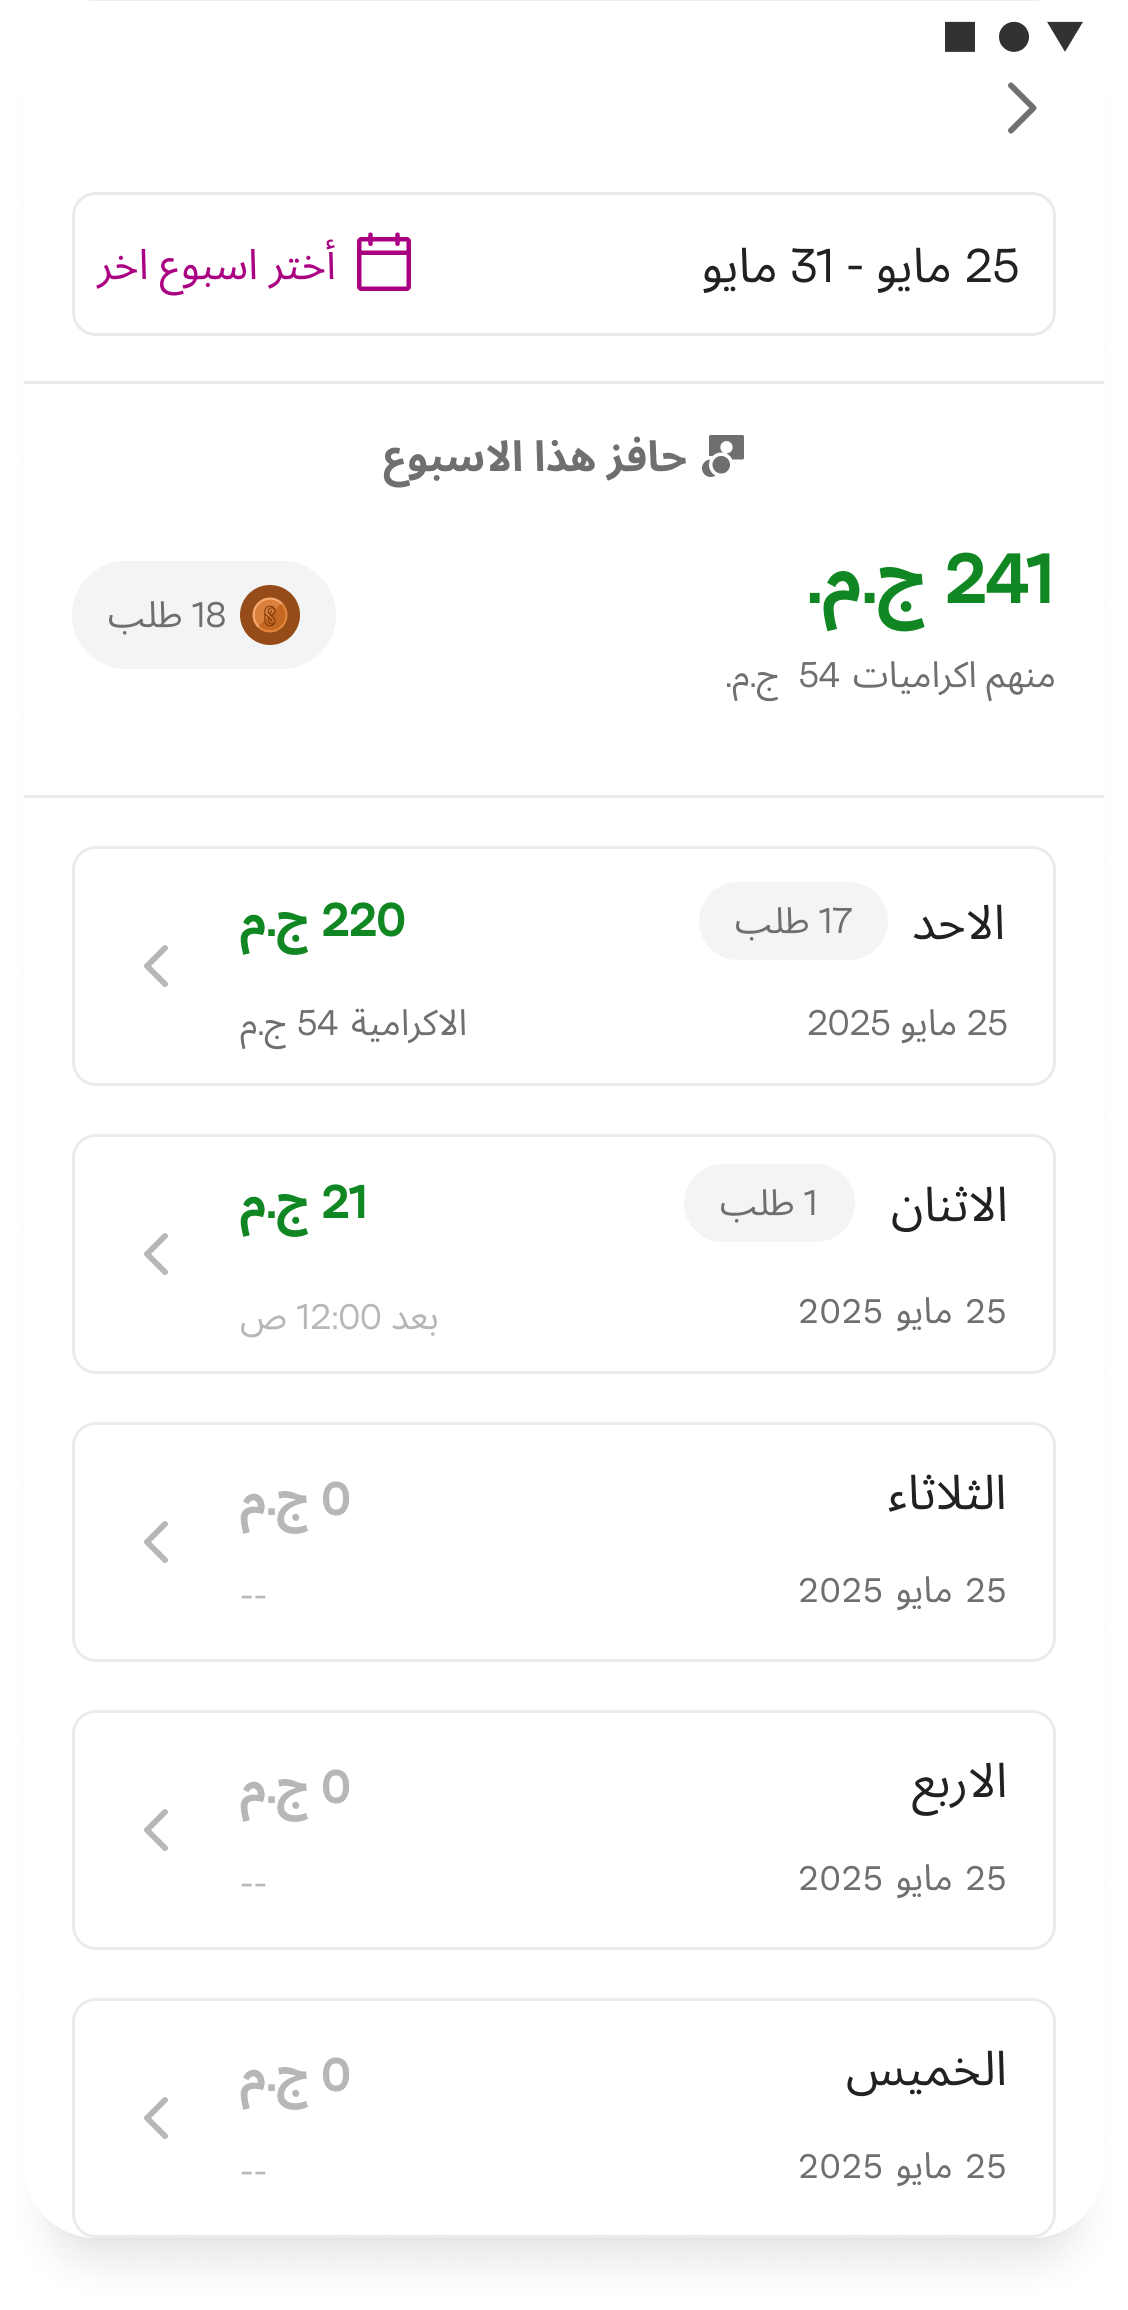
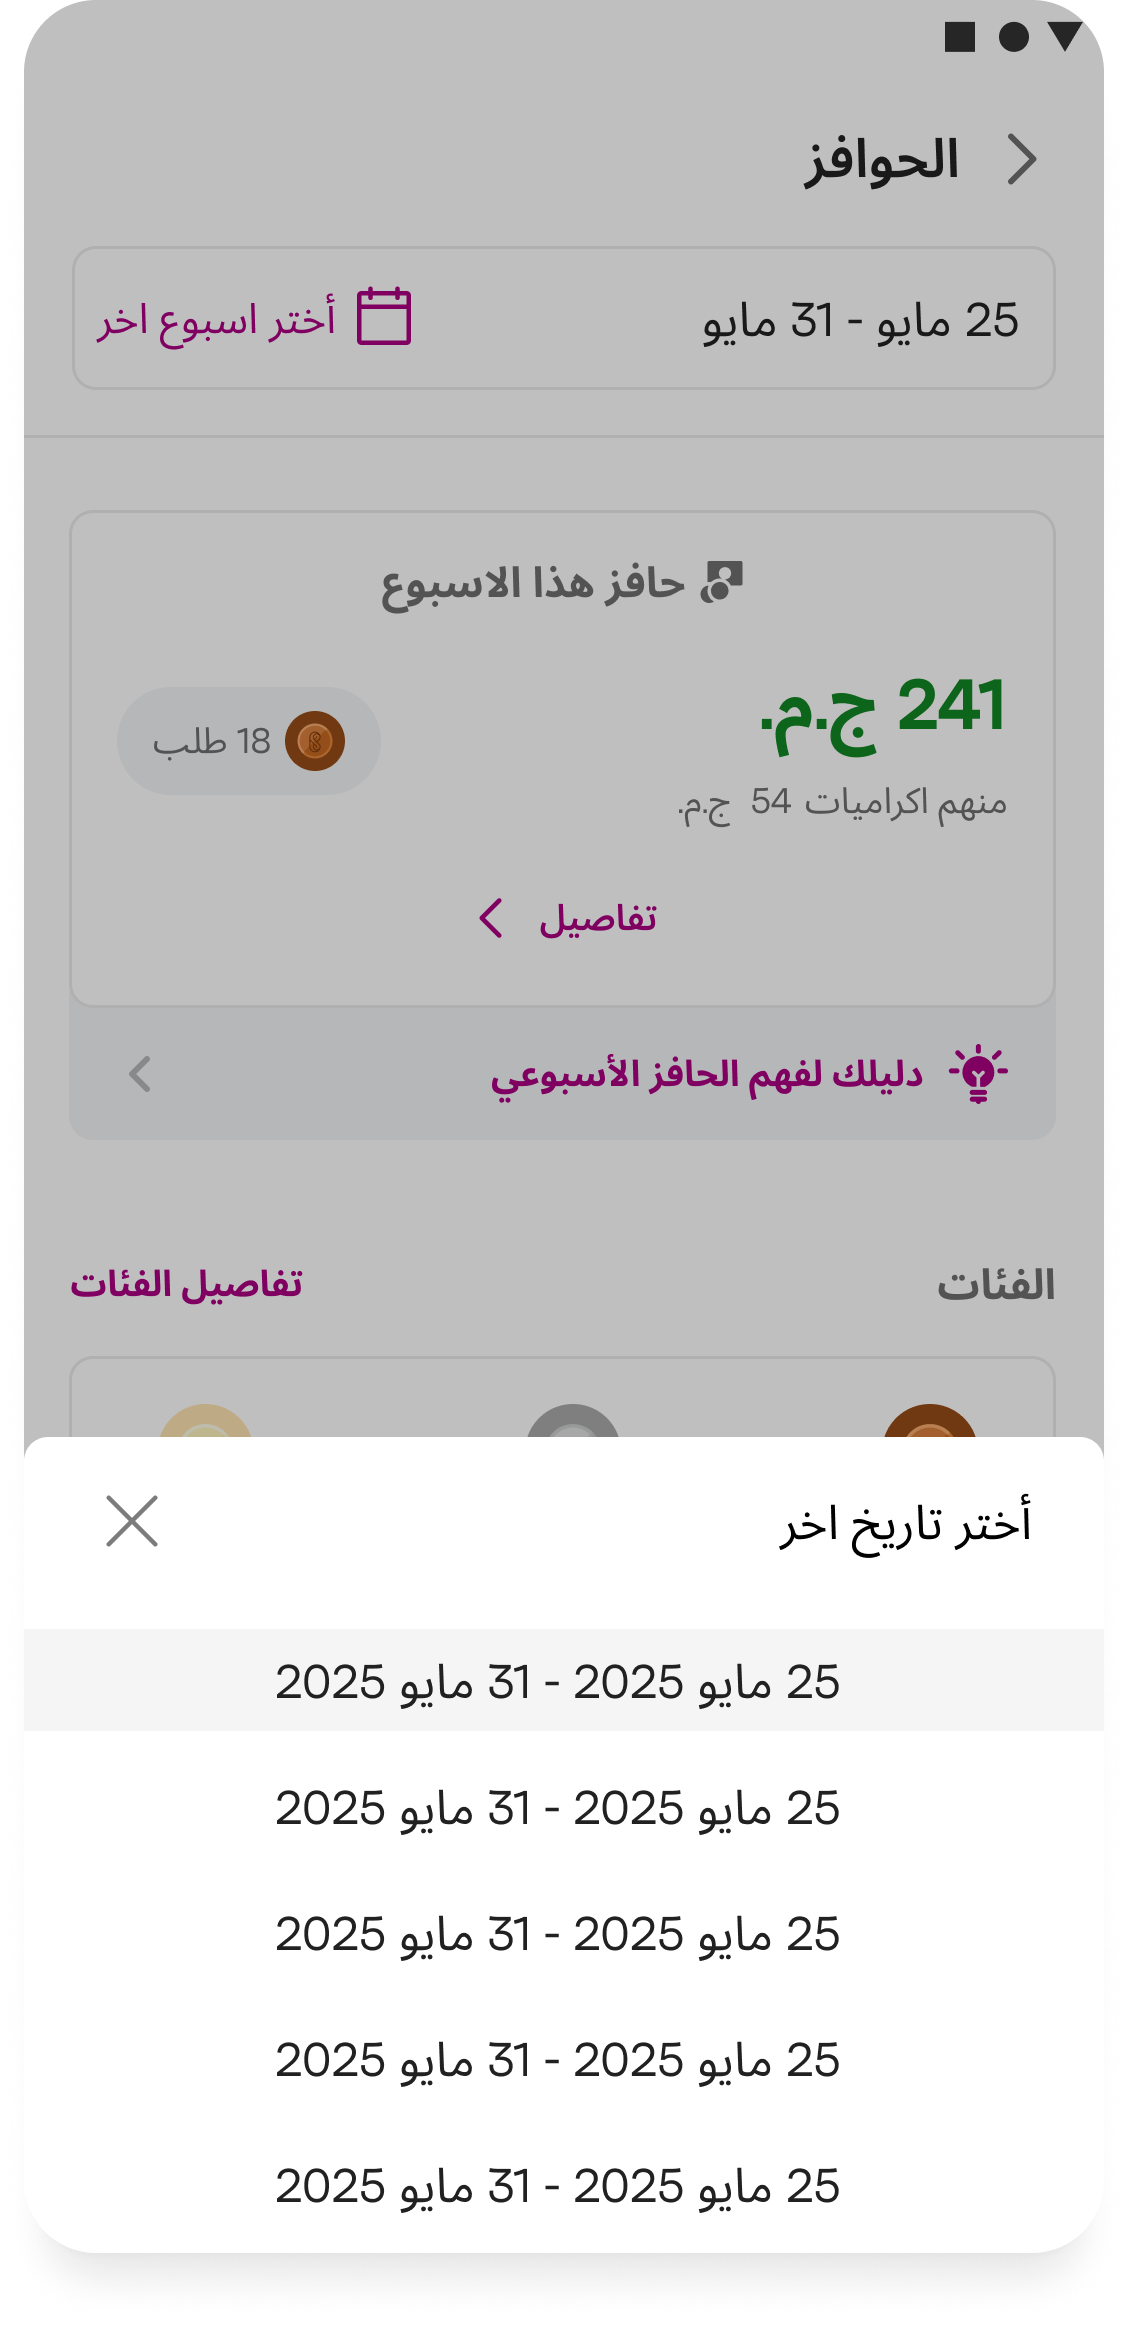
Inside the existing Fleet App, I designed an incentives section that shows exactly how much a DA has earned the moment an order is completed. They can view a full earnings summary, browse history across previous days and pay cycles, and see precisely which custom incentives are active on any given day.
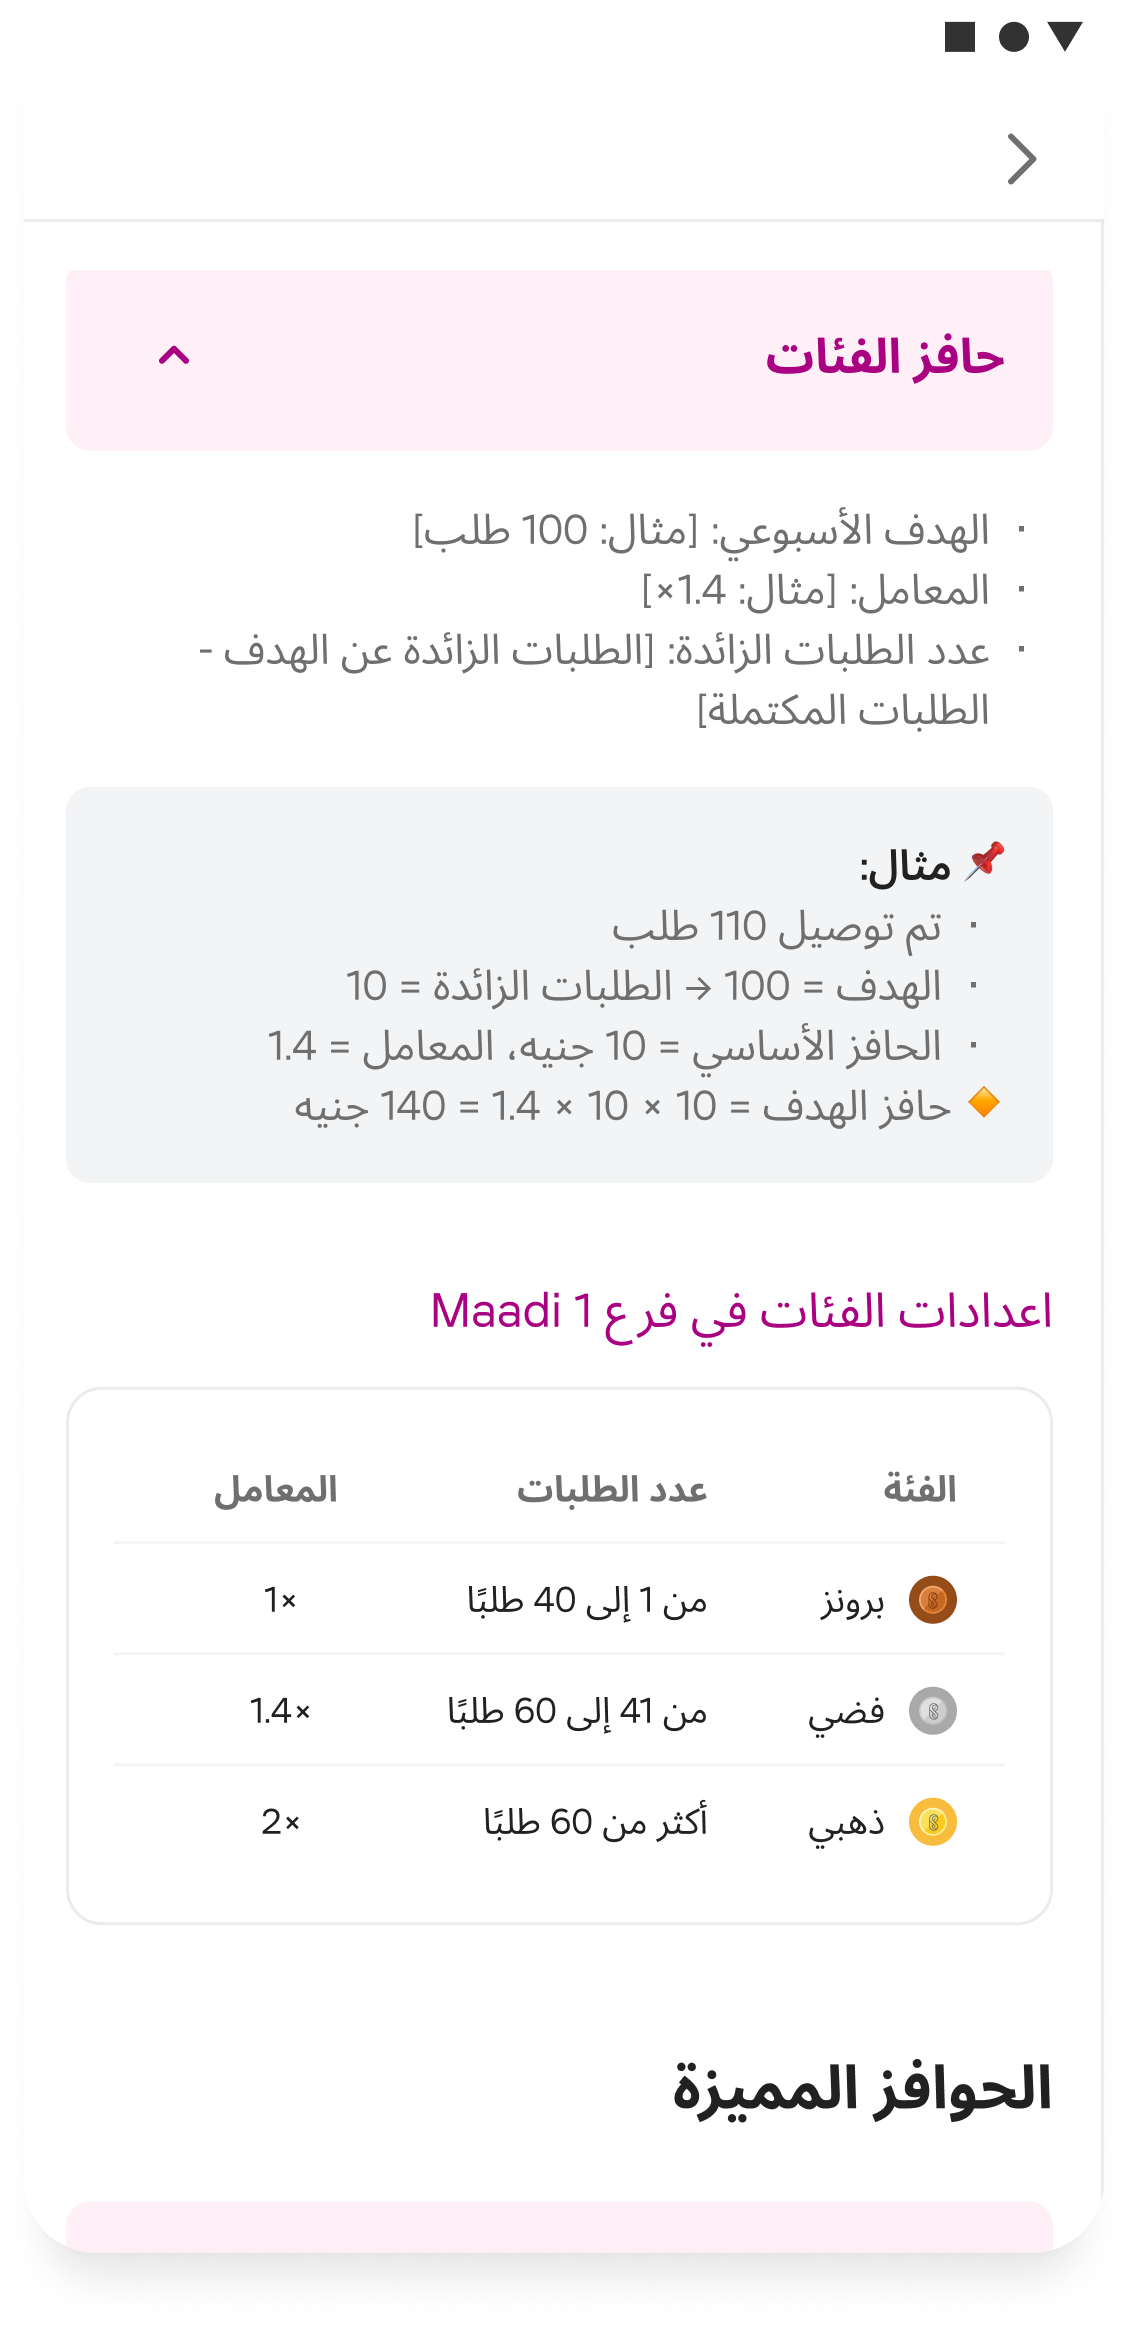
The entire interface is Arabic, right to left, including the numeric and tabular layouts, which is where RTL financial UI gets genuinely difficult.
( 08 · Designing for non readers )
Numbers over words
Many DAs cannot read or write. That was the constraint the entire DA facing design had to absorb, and it is a hard one, because the thing we needed to communicate was a pay calculation with several moving parts.
What the research made clear is that not reading says nothing about capability with numbers. These are people who set their own daily and cycle targets, track payouts order by order, and catch errors in their own pay. They read numbers fluently. They just couldn't read the words around them. So I built the interface out of the thing they already understood.
The point isn't to remove language. It's to make sure nothing important depends on it. The order breakdown is the clearest case: every row pairs an icon with a figure, and the figures carry the weight. The order total, each incentive that contributed, the multiplier where one applied, a deduction in red with a minus sign.
The Arabic labels are there, and they matter for the DAs who read them. But a driver who doesn't can still read the row, because the icon says which incentive and the number says how much. That is the screen that replaces the notes app.
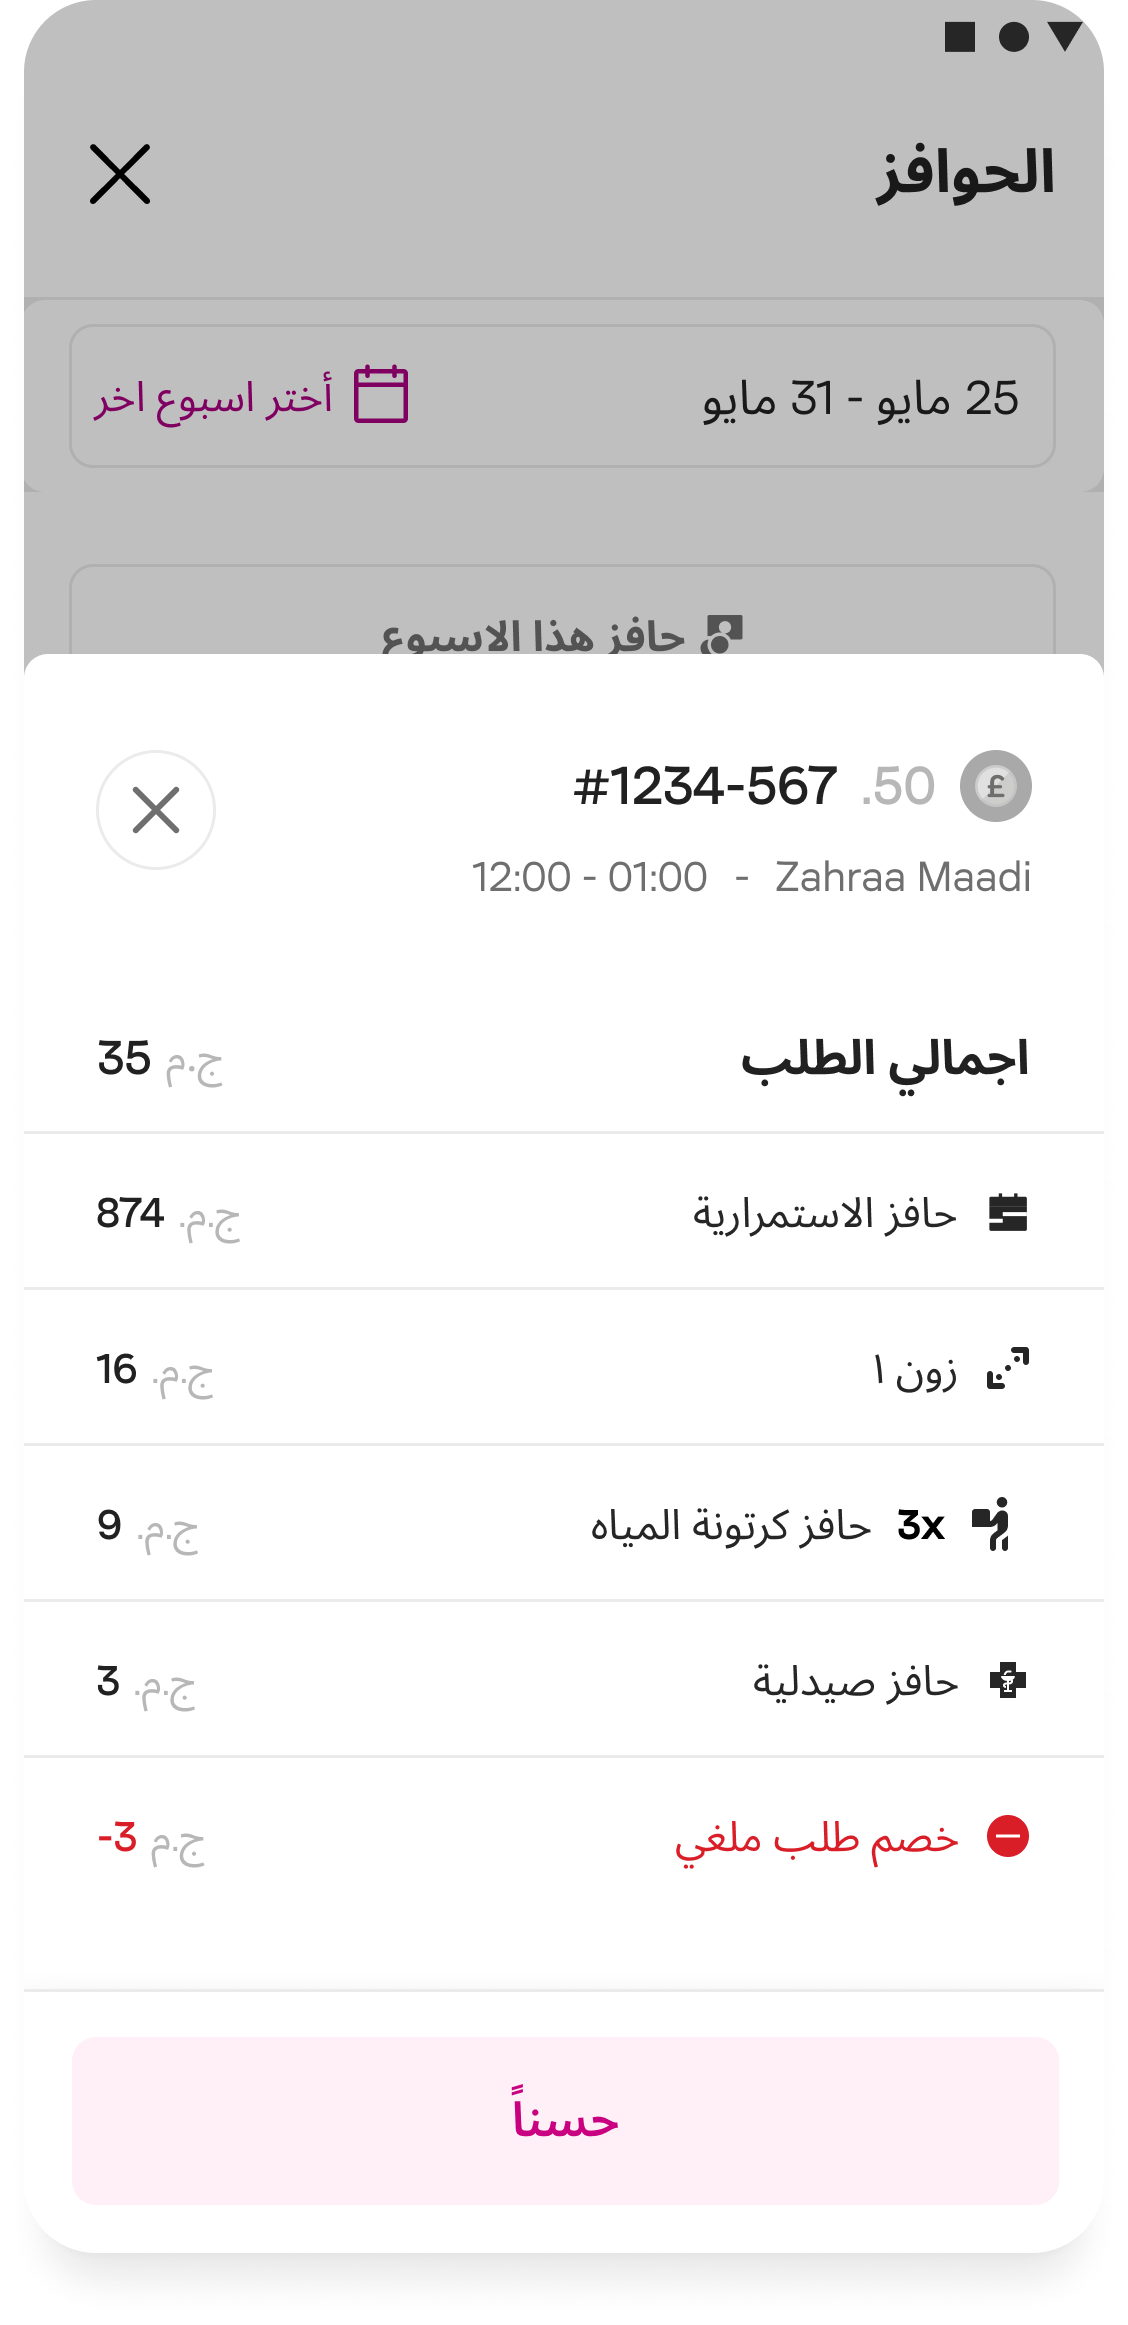
Numbers carry the interface
Amounts, order counts and multipliers are the largest elements on screen. Words are present, but they are never the only thing carrying a meaning.
Icons do the labelling
The bilingual icon set built for the dashboard was reused here as a visual vocabulary. A DA learns each incentive's mark once and recognises it everywhere.
Tiers make progress legible
I designed the bronze, silver and gold structure so where you stand and what pushing further is worth can both be read at a glance. The thresholds and multipliers behind it are configured per fulfilment point rather than fixed.
Colour carries state
Completed, in progress and missed are distinguished by colour and icon together, so status never depends on reading a label.
( 09 · Validation )
Testing with the people it was actually for
Because I worked at Breadfast and so did the DAs, testing was a matter of going to where they were. I visited fulfilment points and ran the designs with associates in person, in the middle of their working day.
I specifically recruited participants who could not read or write. Testing a pay interface with people who could read would have told me nothing about whether it worked for the people it was built for.
The first version didn't have enough icons. I had leaned on numbers and layout, assuming the structure alone would carry it, and watching people use it made clear they needed more visual anchors to tell incentive types apart. I iterated and added icons throughout. That is how the icon set went from a scannability aid in the dashboard to a load bearing part of how the DA app communicates at all.
( 10 · Impact )
Results
"For the first time, I feel like Breadfast actually sees us."DA 2
Retention. DA attrition dropped by roughly 40%, the outcome the project existed to produce, at a moment when competitors were actively recruiting our drivers.
Adoption. 100% of active Delivery Associates. Not a rollout that needed selling. DAs had been asking for this for years.
Pay transparency. Thousands of DAs across Egypt gained live visibility into their earnings for the first time.
Engineering effort. Roughly 80% reduction in engineering involvement for incentive configuration. Change implementation dropped from several days to minutes.
Operations. Coordinators eliminated their dependency on a manually maintained spreadsheet, removing a major source of payment errors, and payment disputes fell with it.
Morale. I did not measure this formally, so I will report it as what it was. In follow up conversations at fulfilment points, DAs described the change in how they felt about working for Breadfast in terms none of the metrics above capture.
( 11 · What's next )
Built to be extended
This shipped as a foundation rather than a finished product. The incentive taxonomy was deliberately built so new types could be added without redesigning the system, and the tier structure is the obvious place to build on next.
The natural next step is gamifying the DA experience: turning progress toward the next multiplier from something a driver checks into something they actively play toward. The research showed these are people already setting their own targets and tracking their own numbers. The system currently reports back to them. It does not yet meet them where that motivation already is.
All product screens shown are live and shipped. Sensitive operational data has been anonymised.